5 Why?
This is a basic Six Sigma problem-solving method.
It allows us to go beyond the symptomatic causes and find the fundamental causes (on which we can then act to eliminate the problem once and for all).
The principle is to go back to the root cause by asking the question why 5 times in a tree structure.
5 M
5 fundamental causes of process dispersion: Material, Methods, Means, Environment, Manpower.
These 5 causes are already set out in Shewhart's first book.
We generally dissociate the production process with its 5M and the measurement process with its 5M (Mesurande then replaces Matière).
5 S
Lean method structured in 5 phases corresponding to 5 Japanese concepts (Seiri, Seiton, Seiso, Seiketsu, Shitsuke / Sort - Set in order - Shine - Standardize - Sustain in English).
Based on the hunt for waste in an area or piece of equipment, the 5S method is used to create a good working environment for value-added operations. It enables operational improvement that goes beyond order and cleanliness, through the implementation of standards and the maturity of the team.
It can be used in both industry and service.
A 3
Methodology invented by Toyota to manage problem solving and which summarises the actions carried out (project progress).
Alpha, Alpha risk, First-species risk
The Alpha risk corresponds to the risk of concluding that there is a difference between two samples, when in reality there is no difference.
FMEA
Failure Mode and Effect Analysis. This is a tool for listing risks and assessing them according to 3 criteria: severity, ease of detection and frequency of occurrence.
Process analysis
Process mapping method used to visualise the sequence of elementary tasks in a process or part of a process. Each task is valued (time, distance, quantity, etc.) with the aim of improving the process.
Stakeholder analysis
Stakeholder analysis is part of the DEFINE stage. We look for all the people who will be affected by the project, i.e. :
- the people involved in the project
- people interested in the project
- people who can influence the project.
The stakeholder analysis is carried out by the GB or BB. It facilitates the formation of the project team and the creation of the communication plan. It evolves throughout the project
ANAVAR (ANOVA)
ANAlyse de la VARiance, ANalysis Of VAriance. This is a hypothesis test used to compare the mean of several samples.
ANDON
An ANDON is a warning light or panel that lights up when the operator presses an alert button. The ANDON is followed by a problem resolution carried out at increasingly expert levels according to the time spent on the resolution. The aim is to minimise disruption to or stoppage of production.
APC
Evolution of the MSP/SPC to adapt to cases where there is a dependency between several characteristics and where precise adjustment is required with a minimum of information.
Decision tree - Regression tree
Machine learning method adapted to discrete Y responses allowing to find a prediction model from a decision tree such as :
Decision Tree Regression
0 =: (0 <= 0.989) && (1 <= 1.7525)
0 =: (0 1.7525) && (3 <= 0.5)
0 =: (0 1.7525) && (3 > 0.5)
0 =: (0 > 0.989) && (2 -0.681)
0 =: (0 > 0.989) && (2 <= 0.5) && (1 0.5)
1 =: (0 > 0.989) && (2 > 0.5)
1 =: (0 > 0.989) && (2 <= 0.5) && (1 <= -0.681) && (3 <= 0.5)
Cause tree
It is a risk analysis tool that starts with a feared event and works backwards to identify the possible causes in the form of a cause tree.
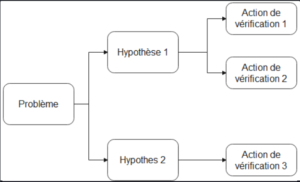
Hypothesis tree
The starting point is an objective to be achieved. We will list the hypotheses for achieving this objective and list the experiments to validate these hypotheses (the branches of the tree).
Attributes
There are two types of data. CONTINUOUS and DISCRETE data. Discrete data is qualified by attributes that can take 2 forms (Good / Bad, 0 / 1 , OK / NOK...) or more than 2 (Good, Average, Bad).
Self-control
Summarises all the methods and tools designed to enable the operator to guarantee - independently - control of safety, quality, deadlines and costs, directly at his workstation.
Baseline
Baseline can be translated as "reference point" in French. The aim is to know the initial capability of the process before making any improvements, in order to compare the situation BEFORE and AFTER the Lean Six Sigma project.
Benchmarking
A method originating in marketing which consists of comparing one's way of doing things or one's performance with that of the best companies in the same sector or with that of companies with a recognised performance in the same area of expertise.
Beta Beta risk Second species risk
The Beta risk is the risk of concluding that there is no difference between two samples, when in fact there is.
Binomial
The binomial distribution applies to discrete data. It is used to calculate the probability of drawing k characters X from a sample of size n drawn from a batch where the probability of having X is equal to p.
Black Belt (BB)
A "Black Belt" is a person trained in the Six Sigma methodology whose main role is to lead improvement projects using the Six Sigma methodology and tools.
BoxPlot moustache box
This is a graphical representation of statistical data. The box plot (also known as a box diagram, Tukey box or box plot) gives an idea of the distribution of values in the form of a box (50% of the population) and whiskers (2 lines covering the whole population).
Brainstorming (unpacking ideas)
Brainstorming is a process that enables a large volume of ideas to be generated quickly, in an atmosphere free from criticism and judgement. First, the brainstorming facilitator poses the question to be resolved. Then, he or she stimulates the production of ideas without acting as a judge. Once all the ideas have been presented, they are reread with the group to check that the ideas are clear, that they answer the question, and to eliminate duplications.
Capability
Process capability is the measure of the ability of the process to meet customer expectations. It is the ratio between the required performance and the actual performance of the process.
Capability - Attributes
In the case of attributive criteria, the capability is calculated with an equivalent Ppk which gives the same proportion of defects as in the case of measurements.
Measurement process capability
It is used to validate the possibility of using a measurement process for a characteristic.
Control Card
A control chart allows you to visually monitor and control a process to identify any drift and ensure its stability over time.
Multivariate map T²
A multi-dimensional control chart used to study whether a set of several characteristics remain under control.
An indicator T² is calculated, which is the distance between each point and the centre of the point cloud. If the distribution follows a multidimensional normal distribution, we can calculate a control limit on this distance T².
Value Stream Mapping (VSM)
Value stream mapping is a graphic representation of the flow of materials and the flow of information.
In general, two maps are produced:
- Current mapping of the value stream: this is a graphical representation of the current flow of materials and information.
- Ideal value stream mapping: this is a graphical representation of the flow of materials and information as they might ideally be.
Process mapping
Process mapping is a graphical representation of the stages (in chronological order) that clearly shows how process inputs are transformed into outputs for the customer.
Functional mapping of the process (Swimlane mapping)
Functional process mapping shows the stages in the process through the company's departments or business lines. (Each department has its own corridor)
Root cause
That's where the problem lies... in our possible area of intervention.
Special cause
Source of irregular variation that is difficult to predict. For example, machine misalignment, wear or breakage.
Common causes
The common causes form the intrinsic variability of the process. They are due to a sum of small causes which satisfy the central limit theorem. When only common causes remain, the distribution of values follows a Gaussian distribution.
Champion
The champion is an important person in the Lean Six Sigma organisation, as he or she is responsible for deploying the method throughout the company.
Project Charter
The project charter is a key element in the construction phase of a project.
It will summarise the problem to be solved, the objective to be achieved and the scope concerned. It will also define the project's roles and responsibilities, as well as the main milestones. The Six Sigma method rightly stresses the importance of this document and the commitment of each project member to seeing the project through to a successful conclusion.
Correlation coefficient
A numerical value that characterises the relationship - meaning and importance - between two random variables or two statistical variables.
This value can be positive, negative or zero. Note that the value of the coefficient is zero when the two variables in question are independent.
Determination coefficient
The coefficient of determination (R², the square of the linear correlation coefficient r) is an indicator used to judge the quality of a simple linear regression. It measures how well the model fits the observed data, or how well the regression equation describes the distribution of points.
By abuse of language, it is often referred to as the correlation coefficient.
Data collection
Part of the MEASURE stage. The data collection plan is organised to maximise the chances of success in the ANALYSE stage.
A data collection plan is prepared by asking the following questions:
- WHO is concerned?
- WHAT to collect
- WHERE to collect?
- HOW to organise the collection?
- WHEN? When? How often?
- HOW MUCH? What sample size?
Short term
Period short enough to consider that the process is under control
Cp
Short-term capability indicator for a process, regardless of its focus. Six sigma requires a Cp > 2.
Cpc
Control process capability. It indicates whether the control process is suitable in terms of repeatability and reproducibility.
Cpc is equivalent to R&R (Cpc = 1/R&R).
In general, we consider :
- Cpc ≥ 4 (R&R% ≤25%), the process is capable of
- Cpc ≥ 3 (R&R% ≤33%), the process is borderline
- Cpc 3), the process is not suitable
Cpk
Short-term capability indicator for a process that takes account of its centring.
Cpm
Short-term capability indicator based on Taguchi loss.
CTC
CTC is the acronym for Critical to Cost. Cost-related CTS are called CTC.
CTD
CTD stands for "Critical to Delivery".
CTS linked to the product or service lead time are called CTD.
CTQ
CTQ stands for "Critical to Quality".
CTS linked to the Quality of the product or service are called CTQ.
CTS (CTQ, CTC, CTD)
CTS stands for 'Critical to Satisfaction'.
CTS are the main measurable characteristics of a service or product whose specification limits must be respected to satisfy the customer. CTS are defined in terms of the Voice of the Customer (VOC).
Operational definition (of data)
Precise description indicating how to obtain a value for a characteristic to be measured: it describes the characteristic and indicates how to measure it.
DFSS Design For Six Sigma
It is a methodology that brings together best practices for designing a product, process or service that directly achieves the Six Sigma objective. The DFSS follows the DMADV approach.
Vertical strip chart
Vertical bars show how a variable changes over time.
Stacked bar chart
Used to represent a matrix of two discrete variables.
Circular diagram
Used to represent the distribution of the modalities of a discrete variable.
Affinity diagram (also called KJ diagram)
It is a basic quality tool. It is used, for example, to clarify and summarise the results of a brainstorming session. All the ideas put forward are grouped by affinity. Each grouping is given a title.
The work of bringing ideas together in a working group enables team members to take ownership of them. It encourages creativity and the search for innovative links between ideas.
The 5 M diagram is in fact an affinity diagram for which the grouping headings are predefined.
Point diagram
A dot plot divides the sample values into small intervals and represents each value or small group of values by a point along a number line. The dot plot is suitable when the sample size is less than around 50.
Scatter diagram (point cloud)
Used to visualise any correlation between two quantitative variables.
Process management diagram
The process management diagram makes it possible to document the mapping of the process, the measures to be controlled at each essential stage of the process and the plan for responses and actions when the process does not remain within operational limits.
Kano diagram
Diagram used to classify attributes according to two axes:
- the axis of realisation from the unprocessed attribute to the fully processed attribute
- the axis of satisfaction from dissatisfied to very satisfied. The attributes are classified into 3 categories:
- Must be - (Obligatoires, indispensables)
- Attractive - (attractive)
- Proportional or linear - (One-Dimensional)
We have also added 2 new categories:
- Indifferent - (Zone of indifference)
- A double tranchant - (Reverse)
Time series diagram
A time series is a series of values for the same variable observed at regularly spaced points in time (day, month, year).
The vertical bar chart or control chart are examples of time series diagrams.
In a time series diagram, the X axis represents time.
5M diagram or cause/effect diagram or Ishikawa diagram or fishbone diagram
This tool, with its many names, is a support tool for workshop leaders looking for causes. It helps to generate a list of ideas during a creativity session by structuring thinking around the 5Ms: Manpower, Material, Methods, Machines, Environment.
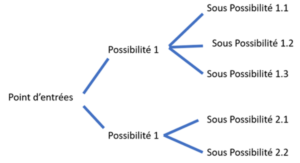
Tree diagram
The tree diagram is a tool for finding ways of improving a situation, and for planning the sequence of stages in implementing solutions, while identifying the key points to be observed in monitoring implementation.
Bar chart
Used to represent the distribution of the modalities of a discrete variable.
Spaghetti diagram
The spaghetti diagram is a tool used to provide a clear view of the flow of parts or individuals. All the routes taken are plotted on a map. It takes its name from its resemblance to a dish of spaghetti. This visualisation enables redundant flows and recurring crossings to be identified and the path taken by each product or person to be measured.
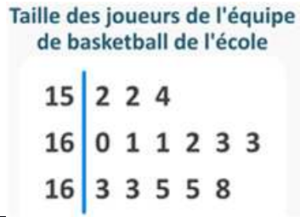
Stem & leaf diagram
A diagram that allows data from the distribution of a statistical variable to be broken down and represented graphically in the form of a histogram.
Each individual item of data is represented by its stem (first digits common to several items of data) and its leaf (last digits of these same items of data).
DMADV
Define, Measure, Analyse, Design, Validate
DMAIC
Define, Measure, Analyse, Improve, Control. Six sigma project management method.
Continuous data
Data represented by a real number that can (theoretically) take on an infinite number of values.
Discrete data
Data that can take a finite number of values. Example: Machine A, B and C
Ordinal discrete data
Discrete data that can be ordered. Example: Good Average Bad
DPMO
Defect Per Million Opportunities. Unit used in Lean Six Sigma to define the capability of a process. DPMO = [Number of defects X 1,000,000] / [Number of parts X Number of opportunities].
Henry's right
The Henry line is a graphical method for fitting a Gaussian distribution to that of a series of observations (of a continuous numerical variable). When a fit is made, the points line up on a straight line. It can be used to quickly read the mean and standard deviation of such a distribution.
Standard deviation
The standard deviation is a measure of the dispersion of the data in relation to the mean. It is calculated as the square root of the mean of the deviations from the mean squared.
The standard deviation is meaningful even when normality cannot be demonstrated.
ECC (Critical Customer Requirements)
These are the needs that must be met or customer dissatisfaction will result. ECCs must be measurable.
Sample
It is a sub-group of a population.
Sampling
This involves taking a sample from a population.
There are several ways of sampling: random, stratified, cluster or systematic.
Random sampling
Each element in this sample has the same probability of being chosen as all the other elements in the target population.
Cluster sampling
This involves subdividing a homogeneous population into clusters (subgroups), then randomly selecting clusters and considering all the elements in each cluster. Example: the classes in a secondary school.
We take all the elements of a few randomly chosen classes.
Stratified sampling (quota method)
This involves subdividing a heterogeneous population into strata (subgroups). This method consists of finding the same proportions in the sample for each stratum according to the characteristics chosen for the study in the target population.
Systematic sampling
This method involves drawing up a list of all the elements in the target population and determining the following ratio:
(Number of items in the population)/(Sample size)
Example: A telephone directory contains 4,000 names. I want a sample of 200 individuals. So I calculate 4,000/200 = 20. Then, starting from the beginning of the directory, I choose the 20th, the 40th and the 60th, always in steps of 20.
Measurement error
No measurement system is perfect and therefore introduces a difference between the actual value and the measurement. This difference is the measurement error. There are several types (Bias, Linearity, Stability, Repeatability, Reproducibility).
Scope
This is an indicator of dispersion. The range is calculated as the difference between the maximum value minus the minimum value.
Influential factors
Influential factors are those that have a direct impact and influence on the Ys in the process. They are often the cause. Hence the importance of identifying them (Analysis stage) and dealing with them (Innovation stage).
Flow chart
A flowchart is a type of diagram that represents a workflow or process. A flowchart can also be defined as a schematic representation of an algorithm, a step-by-step approach to solving a task.
The flowchart shows the steps in the form of boxes of different kinds, and their order by linking the boxes with arrows. Flowcharts are used to analyse, design, document or manage a process or programme in various fields.
Green Belt
A Green Belt is a person trained in the DMAIC methodology whose part-time role is to lead process improvement projects.
Green Belts continue to report to operational managers in the departments or business lines.
GRR% - R&R% pledge
Control process capability. It indicates whether the control process is suitable in terms of Repeatability and Reproducibility.
Cpc is equivalent to R&R (Cpc = 1/R&R).
In general, we consider :
- Cpc ≥ 4 (R&R% ≤25%), the process is capable of
- Cpc ≥ 3 (R&R% ≤33%), the process is borderline
- Cpc 3), the process is not suitable
GTV (Time Value Graph)
Graphical representation of Value-Added (VA) tasks and non-VA tasks at a workstation or activity.
Histogram
A histogram is a graphical representation that shows the distribution of a continuous variable using vertical columns.
Hypergeometric
The hypergeometric law applies to discrete data. It is used to calculate the probability of drawing k characters X from a sample of size n drawn from a batch of size N containing D characters X.
Hypothesis H0
Assumption that the difference between the samples is zero.
Hypothesis H1
Assumption that the difference between the samples is non-zero.
Confidence interval
Confidence Interval. The confidence interval is a deviation calculated around the mean to guarantee, with a certain degree of confidence, the difference between the real value of the population and the sample.
Accuracy (Bias)
Systematic difference between the true value and the displayed value.
Means of Measurement Management guarantees the accuracy of the means, not the process.
KPIS
Key performance Indicators. The translation is disputed because the meaning of performance does not correspond perfectly in the two languages. Sometimes the term Key Process Indicators is used.
These key indicators summarise the achievement of the project's objectives. They will be identified during the Define phase. They will form part of the project dashboard and will be updated regularly.
Control limit
Limits to random variations in the statistic observed, which may be an individual value, a mean, a median, a range, a standard deviation, a number of non-compliant individuals or a proportion.
The limits are calculated to within ± 3 standard deviations of the distribution of the statistic under study. As long as the statistic is within the limits, the hypothesis of a deviation due to common causes is not rejected; the process is under control.
Lower Control Limit (LCI)
When a point is below the ICL, we reject the hypothesis that the deviation is due to common causes. We are in the presence of a special cause, the process is out of control.
Upper Control Limit (UCL)
When a point is beyond the ICL, we reject the hypothesis that the deviation is due to common causes. We are in the presence of a special cause; the process is out of control.
Acceptable Quality Limit AQL
This is the maximum limit of non-quality accepted in a Customer/Supplier relationship.
Above this limit, the alpha risk (of being refused a batch of quality p) is greater than 5%.
Specification limit (Tolerances)
A Specification Limit is a value that defines the acceptability of the performance of a service, product or process from the customer's perspective. There is often an Upper Specification Limit and a Lower Specification Limit.
Lower specification limit (LSL)
A lower specification limit is a value above which the performance of a service, product or process is acceptable. Specifications are defined by the customer, based on what is needed to satisfy requirements.
Upper Specification Limit (USL)
An upper specification limit is a value below which the performance of a service, product or process is acceptable.
Linearity (assumption)
This assumption is made in particular in the 2k experimental designs. This hypothesis should be verified, for example, by carrying out a test in the centre.
Linearity (Study of)
Study consisting of checking the linearity of a measurement process in its operating range.
Flow chart
A flowchart is an analysis tool that provides an ordered, sequential representation of all the tasks or events involved in carrying out a given activity. It is made up of a set of symbols linked by arrows.
Each symbol represents an event or a task, and the arrow represents the relationship of precedence or succession between two consecutive tasks.
Binomial law
The binomial distribution applies to discrete data.
It is used to calculate the probability of drawing k characters X from a sample of size n, drawn from a batch where the probability of having X is equal to p.
Normal Law - Gauss Laplace Law
The normal distribution is a symmetrical distribution characterised by a mean and a standard deviation. When a process satisfies the central limit theorem, the distribution follows a Gaussian distribution.
Long term
Normal process production period.
Statistical Process Control SPC
Statistical Process Control. Regroups the methods and tools for controlling a characteristic using control charts and capabilities.
Visual management
Visual Management is first and foremost a management tool that makes performance levels and deviations from targets visible.
It provides useful information for operators and project members.
It makes deviations from the target obvious.
It enables day-to-day performance management (anticipation of results).
It enables resources to be managed: who does what and when?
It makes it easy to run meetings around a visual communication board.
Master Black Belt (MBB)
A Master Black Belt (MBB) is an expert in Lean Six Sigma methodologies, specially trained to coach and mentor process improvement and design teams. This person is not part of any specific project team, but rather serves as an expert resource for several teams. The MBB participates in project reviews, trains Black Belts and Green Belts and ensures that the Lean Six Sigma methodology and tools are used appropriately.
Choice matrix - Solution selection matrix
It's a process of synthesising and selecting solutions.
Selection items are identified and weighted.
Each solution is given a score from 1 to 10 and a weighted score is calculated for each solution.
Prioritisation matrix - Eisenhower matrix
The prioritisation matrix is used to rank actions according to two criteria (e.g. Chance of success/Time to implement) which are placed on the X and Y axes respectively. The actions are placed (for example) in the graph, which is divided into 4 quadrants. Priority is given to actions that can be implemented quickly and have a high chance of success, to the detriment of the last quadrant (which takes a long time to implement and has little chance of success).
Pugh matrix
It's a process of synthesising and selecting solutions.
It makes it possible to evaluate different solutions that will be the easiest to implement, the least costly, the most visible, the quickest to deliver the best results, the best return on investment, the least resistance to change...
The judgement is not absolute but relative to a reference solution. A weighting is assigned to each criterion and the matrix is used to obtain a "score" for each solution.
X/Y matrix - C&E matrix
Cause and Effect Matrix or X/Y Matrix
It allows you to relate several Xs to several weighted Ys. By rating the impact of the Xs on each Y from 1 to 10, for example, the Xs can be ranked in order to focus on the essential Xs.
The C&E Matrix is often mistaken for the Causes/Effects diagram, which is why we prefer to call it the X/Y Matrix.
Median
Value such that 50% of the population are on each side. It characterises the central position of a population. It is less sensitive to outliers than the mean.
Taguchi method
The Taguchi method is an original approach for making Ys insensitive to noise factors using an approach based on experimental designs.
MLG (GLM)
Generalized Linear Model.
This is an extension of the least squares regression method to suit discrete Y variables. The optimisation algorithm to obtain the maximum likelihood of the parameters is no longer a simple least squares calculation but an iterative process.
Mode
In the case of a discrete variable, this is the value with the highest number of individuals.
In the case of a histogram, this is the class with the largest number of values.
Average
Sum of the values divided by the number of values.
It characterises the central position of a population.
MSA
Acronym for Measurement System Analysis. It is a benchmark standard for measurement process control.
MSP (SPC)
Statistical Process Control. Regroups the methods and tools for controlling a characteristic using control charts and capabilities.
Acceptable Quality Level - AQL
This is the old name for the Acceptable Quality Limit.
No Added Value - NVA
An activity that requires time, resources or space, but does not add value to the product itself. The activity may be necessary under current conditions, but from the customer's point of view, it adds no value to the product, but only production costs.
Opportunity
This is a characteristic measured on a unit which must comply with the customer's specifications. It corresponds to the "possibility" of not achieving the specifications.
Pareto
A Pareto chart is a plotting tool that graphically illustrates the "Pareto Principle" or the "80/20 Rule", which postulates that 80% of problems result from 20% of causes, the "major causes". Pareto graphs rank a list of causes in order of priority, depending on the frequency with which they occur.
Stakeholders
All those affected by the project, i.e. :
- the people involved in the project.
- people interested in the project.
- people who can influence the project.
Stakeholder analysis is an important part of the DEFINE stage.
Plan Do Check Act - PDCA
Problem-solving methodology to be used when the solution is known.
Plan: define the scope, obtain the data, formulate the hypotheses, draw up the test programme.
Do: implement, train, inform.
Check: check the results, find a solution quickly, identify the root causes.
Act: prevent recurrence, define standards, communicate, identify new improvements.
Process driver (or process owner)
The Process Manager is the person responsible for all aspects of process execution. He or she is also responsible for the continuous improvement of its performance and control.
Design of experiments (DOE)
DOE, Design Of Experiment.
A design of experiments is a set of tests planned in relation to a set objective. The aim is to carry out the right number of trials to adapt to the desired model while maximising the accuracy of the results.
Data collection plan
Part of the MEASURE stage.
The data collection plan is organised to maximise the chances of success of the ANALYSE stage.
A data collection plan is prepared by asking the following questions:
- WHO is concerned?
- WHAT to collect
- WHERE to collect?
- HOW to organise the collection?
- WHEN? When? How often?
- HOW MUCH? What sample size?
Clearance plan - Screening plan
Design of experiments to prioritise the Xs. With this type of design, we're not looking for a predictive model, but simply to see which Xs have the greatest impact on the Y(s).
Taguchi's L12, L18 and L20 tables are very well adapted. Plackett and Burman's 12- and 20-trial designs are also very suitable. In fact, they are the same tables.
Sampling plan
Reasoned selection of a representative subset of the data relating to a process. It enables accurate conclusions to be reached (at known alpha and beta risks for two reference points) from a relatively small sample.
Plans for Taguchi
Taguchi has proposed an original and simple organisation for experimental designs. This makes it easy for non-statisticians to use experimental designs.
The Taguchi method, on the other hand, is an original approach for making Ys insensitive to noise factors using an approach based on experimental designs.
Response Surface Design of Experiments
These designs allow polynomial quadratic models (with x² terms) to be studied, but with fewer trials than the 3k design.
They are designed to minimise the confidence interval on the coefficients. The best known are the centred composite designs.
Factorial experimental designs
These are plans for which the factors are fixed, either on modalities (discrete X criteria) or on levels (continuous criteria). All the combinations (complete plans) or only some of the combinations (fractional plans) are carried out.
Fish
Poisson's law applies to discrete data.
It is used to calculate the probability of drawing k characters X from a sample, knowing that, on average, lamdba (λ) will be drawn.
Poka-Yoke
Anti-error system that eliminates the possibility of making a mistake. Example: notch on a smartphone SIM card.
Population
Statistical term representing all individuals.
Power to discriminate
Ratio between the measurement dispersion and the dispersion of the products measured.
Pp
Long-term capability indicator for a process, regardless of its focus
Ppk
Long-term capability indicator for a process which takes account of its centring. In general, a Ppk > 1.33 is required.
PPM
Acronym for Game Per Million. Typically used in the context of Defects Per Million Opportunity. Synonymous with DPMO.
Ppm
Long-term capability indicator based on Taguchi loss.
Problem
A problem is defined by a gap between a current situation and a desired situation.
Process
A process is a method, a technique, a way of acting.
Procedure
A procedure is the documented sequence of steps and other instructions required to perform an activity.
Process
A process is a series of steps that transform inputs into outputs (product or service) to meet a customer's STC.
Any activity can be described in terms of a process. The ultimate objective of a process is to add value for the customer. A process generally cuts across several departments or business lines.
Customer process
A set of activities that a company must carry out to transform customer demand into products or services that meet their requirements.
Management processes
A set of activities designed to establish and deploy an organisation's guidelines, to control and correct its activities and to analyse and improve its operations.
Support processes
Support function processes that contribute to the smooth running of customer processes.
Processes, Activities, Tasks
Process: a process is made up of a set of activities.
Activity (or operation): an activity is made up of a set of tasks.
Task: basic elements of a process.
Process Owner (or Process Driver)
The Process Owner is the person responsible for all aspects of process execution. He is also responsible for the continuous improvement of performance and its control.
Measurement protocol
Detailed description of the measurement of an X or Y variable, generally based on QQOQCCP questioning, enabling all aspects to be anticipated.
Power
The power of a test is the probability of declaring a difference to be significant.
The power curve is plotted by varying the deviation on the X axis and placing the power on the Y axis.
The power of a test is used to determine the sample size required.
The power of a test is the complement of the beta risk P = 1 - Beta.
Q1
This is the first quartile. 25% of data are below this value.
Q2
This is the median. This is the value where 50% of points are below and 50% of points are above.
Q3
This is the third quartile. 75% of the data are below this value.
QQOQCP
QQOQCP is an empirical questioning method. Any analysis involves a preliminary phase of "systematic and exhaustive questioning", the quality of which determines the quality of the analysis itself.
This raises the question of WHO? WHAT? WHERE? WHEN? HOW? WHY ?
For each item, we try to be as factual as possible by answering the question HOW MANY.
This method is used to correctly pose a problem, but also to structure the presentation of the results of their analyses, or to create a data collection plan.
QRQC - Quick Response - Quality Control
QRQC is an approach to solving problems as close to the ground as possible.
Above all, QRQC requires us to base ourselves solely on facts (the real world first and foremost), and not on suppositions made far from the field, which very rarely describe reality.
Unlike "in-room" problem-solving methods, QRQC treats the problem as it arises, by directly observing anomalies, analysing objective measurements and involving the people involved.
R
Correlation coefficient (varies between -1 and +1)
R&R - Repeatability & Reproducibility
Control process capability. It indicates whether the control process is suitable in terms of repeatability and reproducibility.
Cpc is equivalent to R&R (Cpc = 1/R&R).
In general, we consider :
- Cpc ≥ 4 (R&R% ≤25%), the process is capable of
- Cpc ≥ 3 (R&R% ≤33%), the process is borderline
- Cpc 3), the process is not suitable
R&R attributes
Capability of the control process by attribute. It indicates whether the control process is suitable in terms of repeatability and reproducibility.
In this test, between 20 and 30 parts are taken, previously checked by an expert (value deemed to be true). Each part is checked several times (repeatability) by several operators (reproducibility).
R²
Coefficient of determination (sometimes called correlation coefficient).
It varies between 0 and 1.
RACI/RASCI
RACI in management represents a matrix of responsibilities which indicates the roles and responsibilities of those involved in each process and activity. This matrix represents the organisation of work by linking the Project Breakdown Structure (WBS) and the Project Organisational Structure (OBS) in a common table.
The RACI matrix provides a simple and clear view of who does what in the project, avoiding duplication of roles or dilution of responsibilities. For example, approval responsibility ("A") must be assigned to a single person within an activity, while several people may be responsible ("R") for carrying it out. There should be at least one "R" per activity. Most of the time, the person who approves the activity ("A") is the line manager of the person who carries it out ("R").
The French translation could therefore be :
- R: Director
- A: Authority or person in charge
- C: Consulted
- I: Informed
RASCI is the same thing, but with the addition of : - S: Support (people or authorities who can provide support. They provide R with resources).
Repeatability
Dispersion of a measurement under stable conditions for the 5 M's of the measurement process: Measurand, Means, Method, Medium, Manpower.
Reproducibility
Dispersion of a measurement when one of the 5 M's of the measurement process is modified. This is often Manpower, but it can also be Means, Method or Environment.
Resolution
This is the reading granularity of a measuring instrument. In practical terms, it is the number of digits after the decimal point that can be read on the measuring instrument.
Insufficient resolution: the resolution must be equal to one tenth of the tolerance!
Example 10 ±0.02 -> tolerance 0.04 mm -> resolution 4 mm
Project review
This is a structured meeting to ensure that the project has delivered the deliverables required for each DMAIC phase (project charter, capability analysis, etc.).
Process review
The reviews enable us to monitor performance and ensure that the process outputs are in line with the objectives and expectations of the process customers. Process reviews are used to identify malfunctions and to propose actions likely to improve the effectiveness and efficiency of the process. Process reviews are conducted by the process owner or manager.
Project risk
Every project has its risks, which need to be identified as early as possible. TOHE risks can be classified as Technical, Organisational, Human and Economic.
Several tools are available to analyse these risks.
These include the SWOT diagram (MOFF), the FMEA, the cause tree, etc.
RTY - Rolled throughput yield
The RTY is calculated by multiplying the yields for each stage of the process.
Calculations can become increasingly complicated as more parallel processes are introduced.
RTY example for serial processes :
RTY = yield of process step 1 * yield of process step 2 * ... * yield of process N
RTYL
Rolled throughput yield Loss -> RTYL = 1-RTY
Chronological series
A time series is a series of values for the same variable observed at regularly spaced points in time (day, month, year).
The vertical bar chart or control chart are examples of time series diagrams.
In a time series diagram, the X axis represents time
Sigma
The Sigma value of the process (noted z) is an indicator of process performance.
This corresponds to the number of standard deviations that can be inserted between the mean and the tolerance.
SIPOC
SIPOC stands for Suppliers, Input, Process, Output, Customers.
The SIPOC is a high-level description (as seen from a helicopter or from the moon) of the process.
Six Sigma
This is a 5-step DMAIC (Define, Measure, Analyse, Innovate, Control) problem-solving method for reducing the variability of a process in order to improve customer satisfaction.
SMART
Characteristics of good lenses :
- Specific (in their definition)
- Measurable (objectively)
- Ambitious / Achievable
- Realists
- Defined in time
SOP
A standard operating procedure (SOP) is a set of step-by-step instructions compiled by an organisation to help workers carry out routine operations. SOPs aim to achieve efficiency, output quality and consistency of performance, while reducing communication problems and non-compliance with industry regulations.
The SOPs are the supports for self-mastery.
Output
An output is the result (product or service) of a transformation carried out by a process. Outputs are the results of processes delivered to customers.
Technical specifications
Precise indication of a set of conditions to be met by a product, material or process, including if necessary the methods for determining whether these conditions are met.
Standard
A standard is an operating procedure defining best practice.
Descriptive statistics
Descriptive statistics are statistical tools used to describe the behaviour of a continuous or discrete variable X or Y.
Inferential statistics
Inferential statistics are statistical tools used to provide evidence of a non-random relationship between a Y and one or more Xs.
Stratification
The principle of dividing data into different sub-groups. For example: by product family, by machine, by type of breakdown, etc.
SWOT (MOFF)
( Strengths - Weaknesses - Opportunities - Threats ) ou MOFF pour les Francophones ( Menaces - Opportunités - Forces - Faiblesses )
This is a very practical tool for the DEFINE phase. It has the advantage of summarising the strengths and weaknesses of the project in relation to the opportunities and threats generated by its environment.
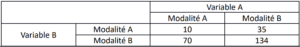
Contingency table
Table showing the distribution of two discrete variables with two or more modalities
Task
A task is an action that is generally assigned to an individual and must be completed within a given timeframe.
Test 1p - Proportion test
Used to compare a proportion with a theoretical proportion.
Normality test
Used to test whether the normality hypothesis can be accepted, the main tests are :
- Test of Anderson Darling
- Kolmogorov Smirnov test
- Chi2 adequacy test
- Test of Ryan Joiner
Chi-square test
There are two chi² tests
- It is used to compare a variance with a theoretical variance.
- It is used to compare the distribution of two discrete variables with 2 or more modalities (contingency table).
Test F
Used to compare two Variances.
Test Kappa
It is an element of R&R with attributes.
The Kappa value is used to measure the correlation between several operators or between an operator and the expert.
Paired t-test
Used to compare two averages in the case of paired samples.
Equivalence tests
Statistical tools used to assess, with a certain degree of risk, whether 2 or more populations are equivalent.
Hypothesis testing
Statistical tools that make it possible to assess, with a certain amount of risk, whether there is a difference between 2 or more populations.
Two-sample t-test
Used to compare two averages.
Test-t à un échantillon - One sample test t
Used to compare an average with a theoretical value.
Central limit theorem
Theorem stated by Gauss.
Any system subject to numerous factors, independent of each other and of an order of magnitude of equivalent effect, generates a normal distribution.
TOHE
Technical Organisational Human Economic
A tool for analysing project risks by classifying them into 4 categories:
T: All technical risks - example: machine capacity.
O: All risks linked to the organisation - example: machine availability.
H: All human-related risks - example: available skills.
E: All risks related to the economic side - example: insufficient budget.
Transformation Box - Cox
It is a mathematical transformation (xλ) that transforms data that does not follow a normal distribution into data that follows a normal distribution. This transformation makes it possible to use standard analysis tools such as control charts, statistical tests, etc., which assume that the data are normal.
Outlier
This is data that is abnormally far from the others. It does not follow the normal distribution.
Variance
A variance is a measure used to characterise the dispersion of a sample or population. The variance is equal to the squared standard deviation.
VOB - Voice of Business
Voice of the Business.
This is the voice of the company: what are the objectives in terms of costs, deadlines, return on investment, etc.?
VOC - Voice of the Customer
Voice of the Customers.
This is the voice of the customer. It helps to clarify the expectations of both customers and project stakeholders.
It is gathered using all the proactive means available (interviews, surveys, polls, discussion groups, etc.) and analysis means available (analysis of historical data, complaints, etc.).
VOP - Voice of the Process
Voice of the Process.
The Voice of the Process (VOP) refers to the various pieces of information used to measure the performance of the process.
VOS - Voix du Social
Voice of the Social.
It's the voice of the environment, safety and employees.
VSM
Value Stream Mapping.
It is a visual tool that displays all the critical stages of a specific process.
It easily quantifies the time and volume required for each stage. Value stream maps show the flow of materials and information as they progress through the process.
X
X is the factor that influences the output of a process.
Factors that have a major impact on the performance of a process output are referred to as "critical Xs" or "essential Xs".
Y
Y is the measurement of a process output
Z
Called the "Sigma value of the process". This is the number of standard deviations that can be inserted between the mean and the tolerance.