Comparing distributions rather than means: a key advance for quality control with the Cramée-von Mises and Energy tests
Two lots of parts. Same mean. Same apparent standard deviation.
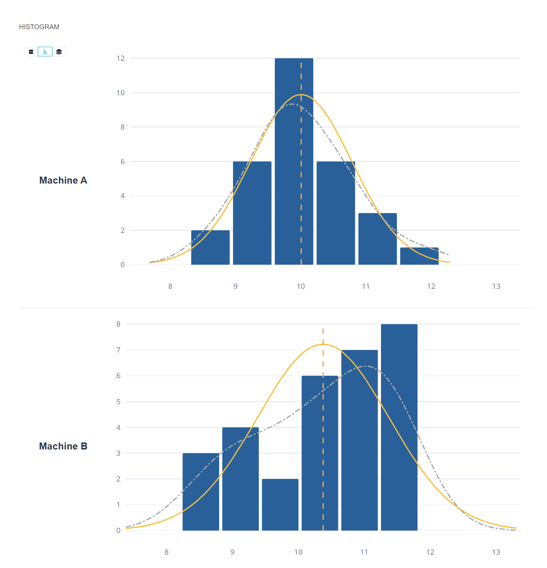
Means and variances here are virtually identical, yet intuitively, you can feel the difference between these two machines.
However, conventional hypothesis testing shows no difference between the two distributions.
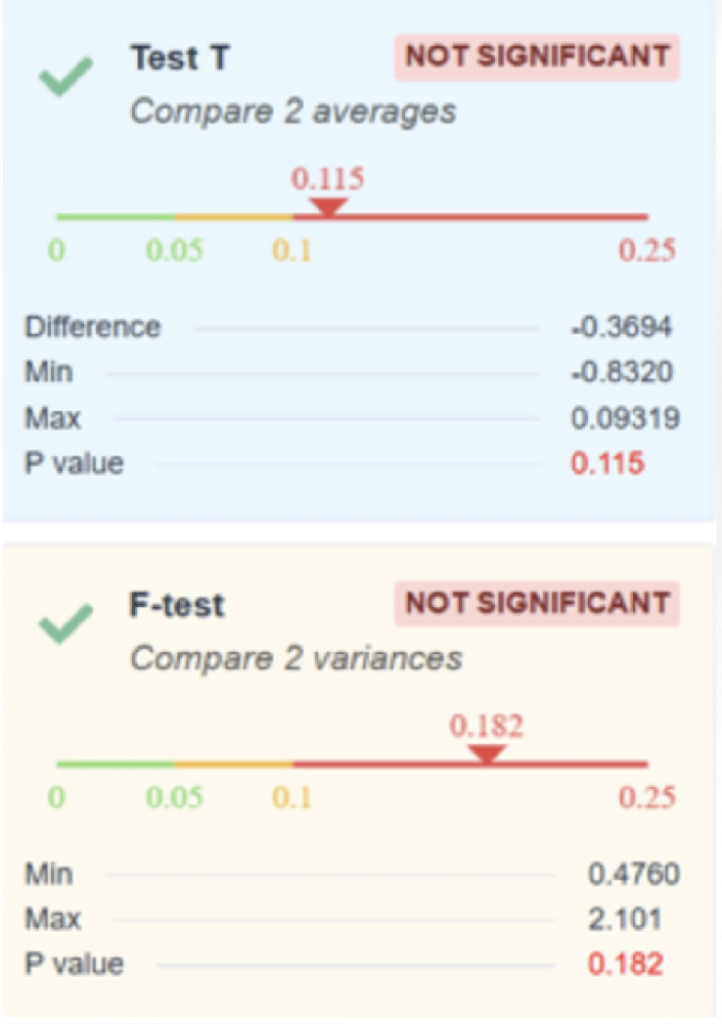
But mean and variance only tell part of the story of a machining process. To detect real differences between measurement groups, between two suppliers, two machines, two shifts, two production periods...you need to compare complete distributions. This is precisely what two statistical tests integrated into Ellistat Data Analysis test: the Cramér-von Mises and the Energy test.
The Cramér-von Mises test
This test compares :
- either a sample with a theoretical distribution
- or two samples between them
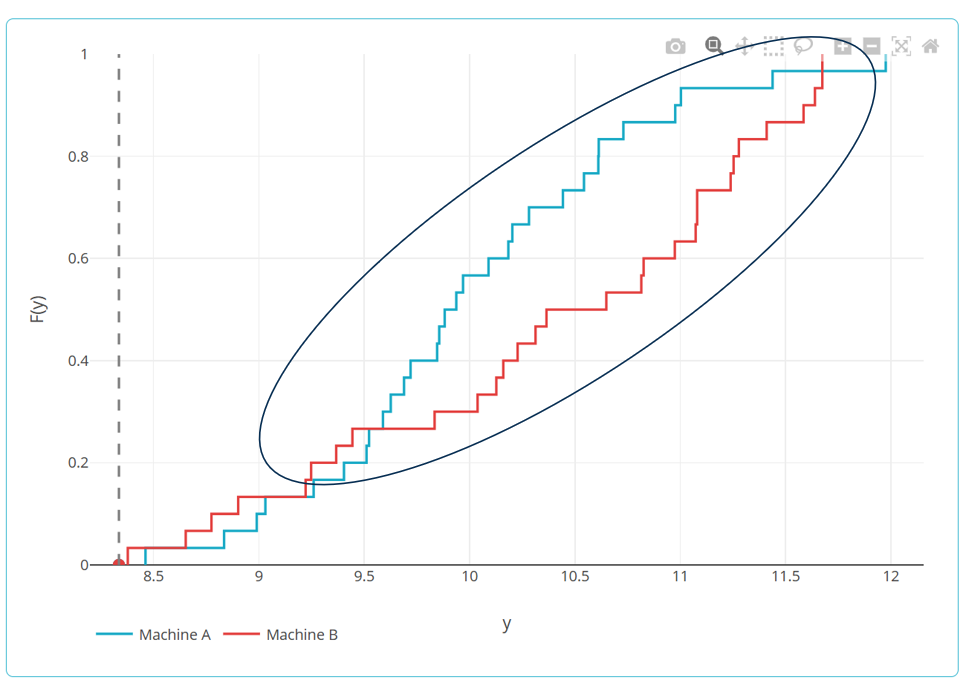
The principle: the test compares the cumulative distribution functions (ogives) of the two distributions.
In other words, it measures «how far apart the cumulative curves are»?
If the two distributions are close, the warheads overlap. If they differ, the cumulative deviation increases.
The energy test
This test generalizes this approach to several groups. It is particularly suitable when :
- more than two populations are compared
- distributions are unknown
- data are multidimensional
The principle The test is based on an intuitive idea: comparing distances between points.
It measures :
- average distances within groups
- then distances between groups
If the groups come from the same distribution, the intra- and inter-group distances are similar. Otherwise, distances between groups become greater.
What this means in practice
Compare two suppliers on a critical diameter. Validate a change of machine setting. Analyze a before/after on an unstable process. Differentiate between two machining centers that produce the same parts...in appearance.
In all these cases, looking only at the mean and variance can be misleading.
Comparing complete distributions gives a true picture of what's really going on.
In Ellistat's Data Analysis module, these tests are coupled with visualizations: ogives, KDE, superimposed histograms, because a p-value without a visual context doesn't convince anyone on the shop floor.
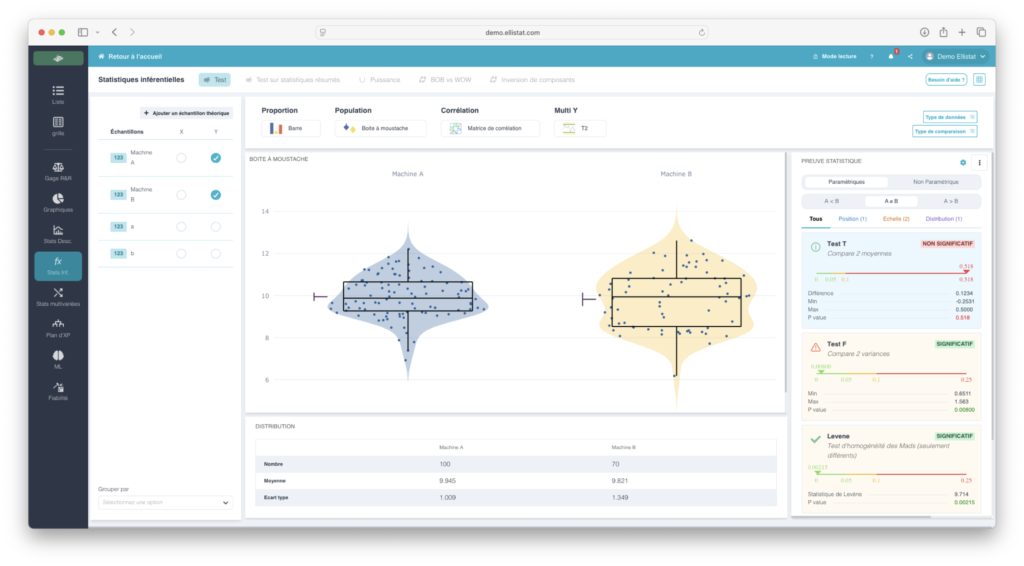
The aim is not to produce a statistical result, but to understand why two processes behave differently and to take action.