


Which statistical software should you choose for the manufacturing industry?
Choosing statistical software suited to the manufacturing industry is no trivial matter. A poor choice can slow down analyses, discourage frontline teams, and ultimately compromise the effectiveness of an entire quality initiative. Yet the market offers dozens of tools with very different focuses: general-purpose software, suites dedicated to quality control, SPC solutions (Statistical Process Control – statistical process control) integrated into production lines. This article helps you structure your decision based on objective and concrete criteria.
Essential Features for the Industry
Not all statistical software uses the same terminology as the industry. Before evaluating a tool, make sure it covers at least these four fundamental areas.
Statistical Process Control (SPC). This is the foundation of any production monitoring system. The software must generate control charts (Shewhart, CUSUM, EWMA) and automatically detect warning signals according to the Nelson or Western Electric rules.
Capability analysis. The Cp, Cpk, Pp, and Ppk indices are used to measure whether a process is capable of meeting the defined tolerances. Good software should calculate these indices, test the data for normality, and suggest alternatives if the distribution is not normal (Weibull distributions, Box-Cox transformations, etc.).
Designs of Experiments (DOE – Design of Experiments). To optimize a process or solve a recurring problem, DOE allows you to test multiple factors simultaneously in a structured manner, thereby reducing the number of trials required.
Measurement Systems Analysis (MSA / R&R). Before analyzing data, it is essential to ensure that the measurement system is reliable. A repeatability and reproducibility (Gage R&R) study quantifies the portion of variability attributable to the instrument or the operator.
General-purpose software or industry-specific solutions: Which should you choose?
There are two main categories of tools on the market.
General-purpose statistical software
Tools such as R, Python (with its scipy and pandas libraries), and SPSS offer considerable computational power. They are ideal for data scientists and engineers with a strong background in statistics. On the other hand, they require a significant learning curve, often involve writing code, and their interfaces are not designed for everyday use in the workshop or quality control room.
Industry-Specific Solutions
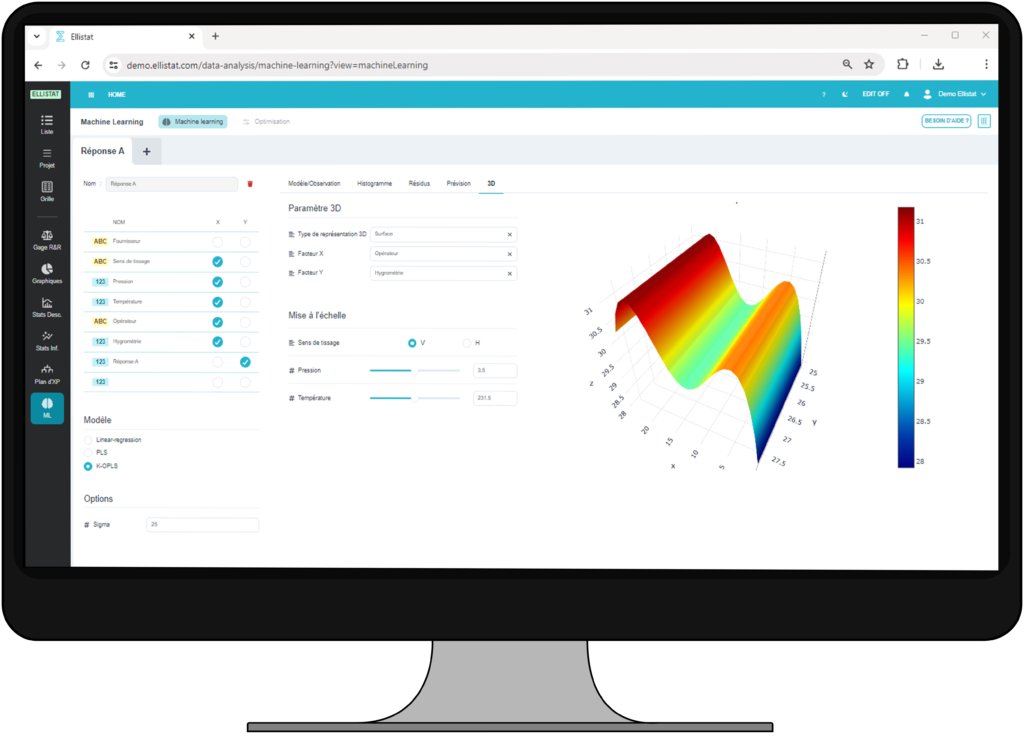
Software such as Minitab, JMP, and Ellistat is designed specifically to meet the needs of quality engineers and Lean Six Sigma practitioners. Their interfaces guide users through the analyses without requiring any programming skills. The results are presented in a format that is immediately interpretable, with built-in decision-making tools. These solutions significantly reduce the time between data collection and operational decision-making.
The choice between these two types depends on your users’ profiles and how often the system is used. For field teams, quality technicians, or production managers, a specialized solution will always be more effective than a general-purpose tool, no matter how powerful it may be.
Criteria That Are Often Overlooked but Crucial
Beyond functionality, several practical considerations often make all the difference in the actual deployment of statistical software.
Data connectivity. Standalone software that only accepts manually entered Excel files quickly becomes a hindrance. Check for compatibility with your existing data sources: MES (Manufacturing Execution System), ERP systems, SQL databases, and automated CSV files.
The deployment method. On-premises software, a cloud solution, or software hosted on your servers? Each option has implications for data security, maintenance, and updates.
How easily teams can adopt it. Software that no one uses provides no value. Prioritize clear interfaces, guided workflows, and accessible training resources. The adoption rate is often the deciding factor between the success and failure of a deployment.
Support and guidance. In industry, problems don't always arise during business hours. Responsive support—ideally in French if your teams work in French—is a significant advantage.
Total Cost of Ownership. Include licenses, training, any specific custom development, and implementation time in your budget comparison.
How to Structure Your Selection Process
A rigorous selection process generally follows four steps. First, map out your actual needs: What types of analyses are currently being performed, by whom, and how often? Next, compile a shortlist of three to five candidates who meet the functional criteria. Next, organize real-world testing using your own production data, involving the future users. Finally, evaluate the return on investment by estimating the time saved on analyses and the non-conformities avoided.
The ideal statistical software for the manufacturing industry isn’t necessarily the most powerful or the best-known—it’s the one your teams will actually use, that integrates with your existing systems, and that produces actionable results as close to the production line as possible. Take the time to test it before making a decision, and involve end users in the selection process from the very beginning.