Gage R&R software
Characterize your measuring equipment
Several Gage R&R analyses can be performed in the same ELLISTAT session.
Discover Data AnalysisEllistat, a new look for R&R's guarantee software
Ellistat is a Gage R&R software package compatible with the MSA standard for validating a measurement process by checking the instrument's repeatability and reproducibility (Gage R&R) and verifying its accuracy.

Test under real conditions
For us, the best way to prove that Ellistat is simple, ergonomic and complete is to let you test it for free for 1 month with your data and with your colleagues!
Gage R&R Ellistat software
Designed to meet specific industry needs
Gage R&R: visual first
Build your R&R pledge in just a few clicks with Ellistat's Data Analysis software
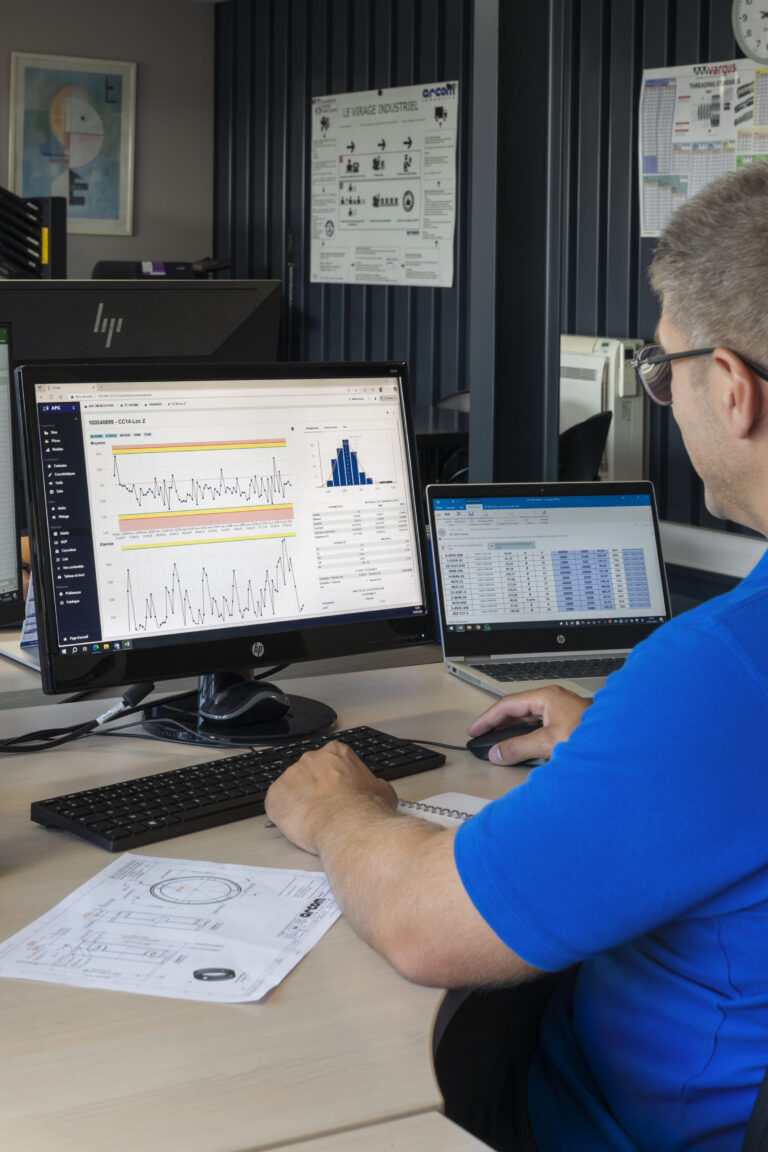
Graphs provide visual information on calculation results. This makes it extremely easy to understand malfunctions in a measurement system.
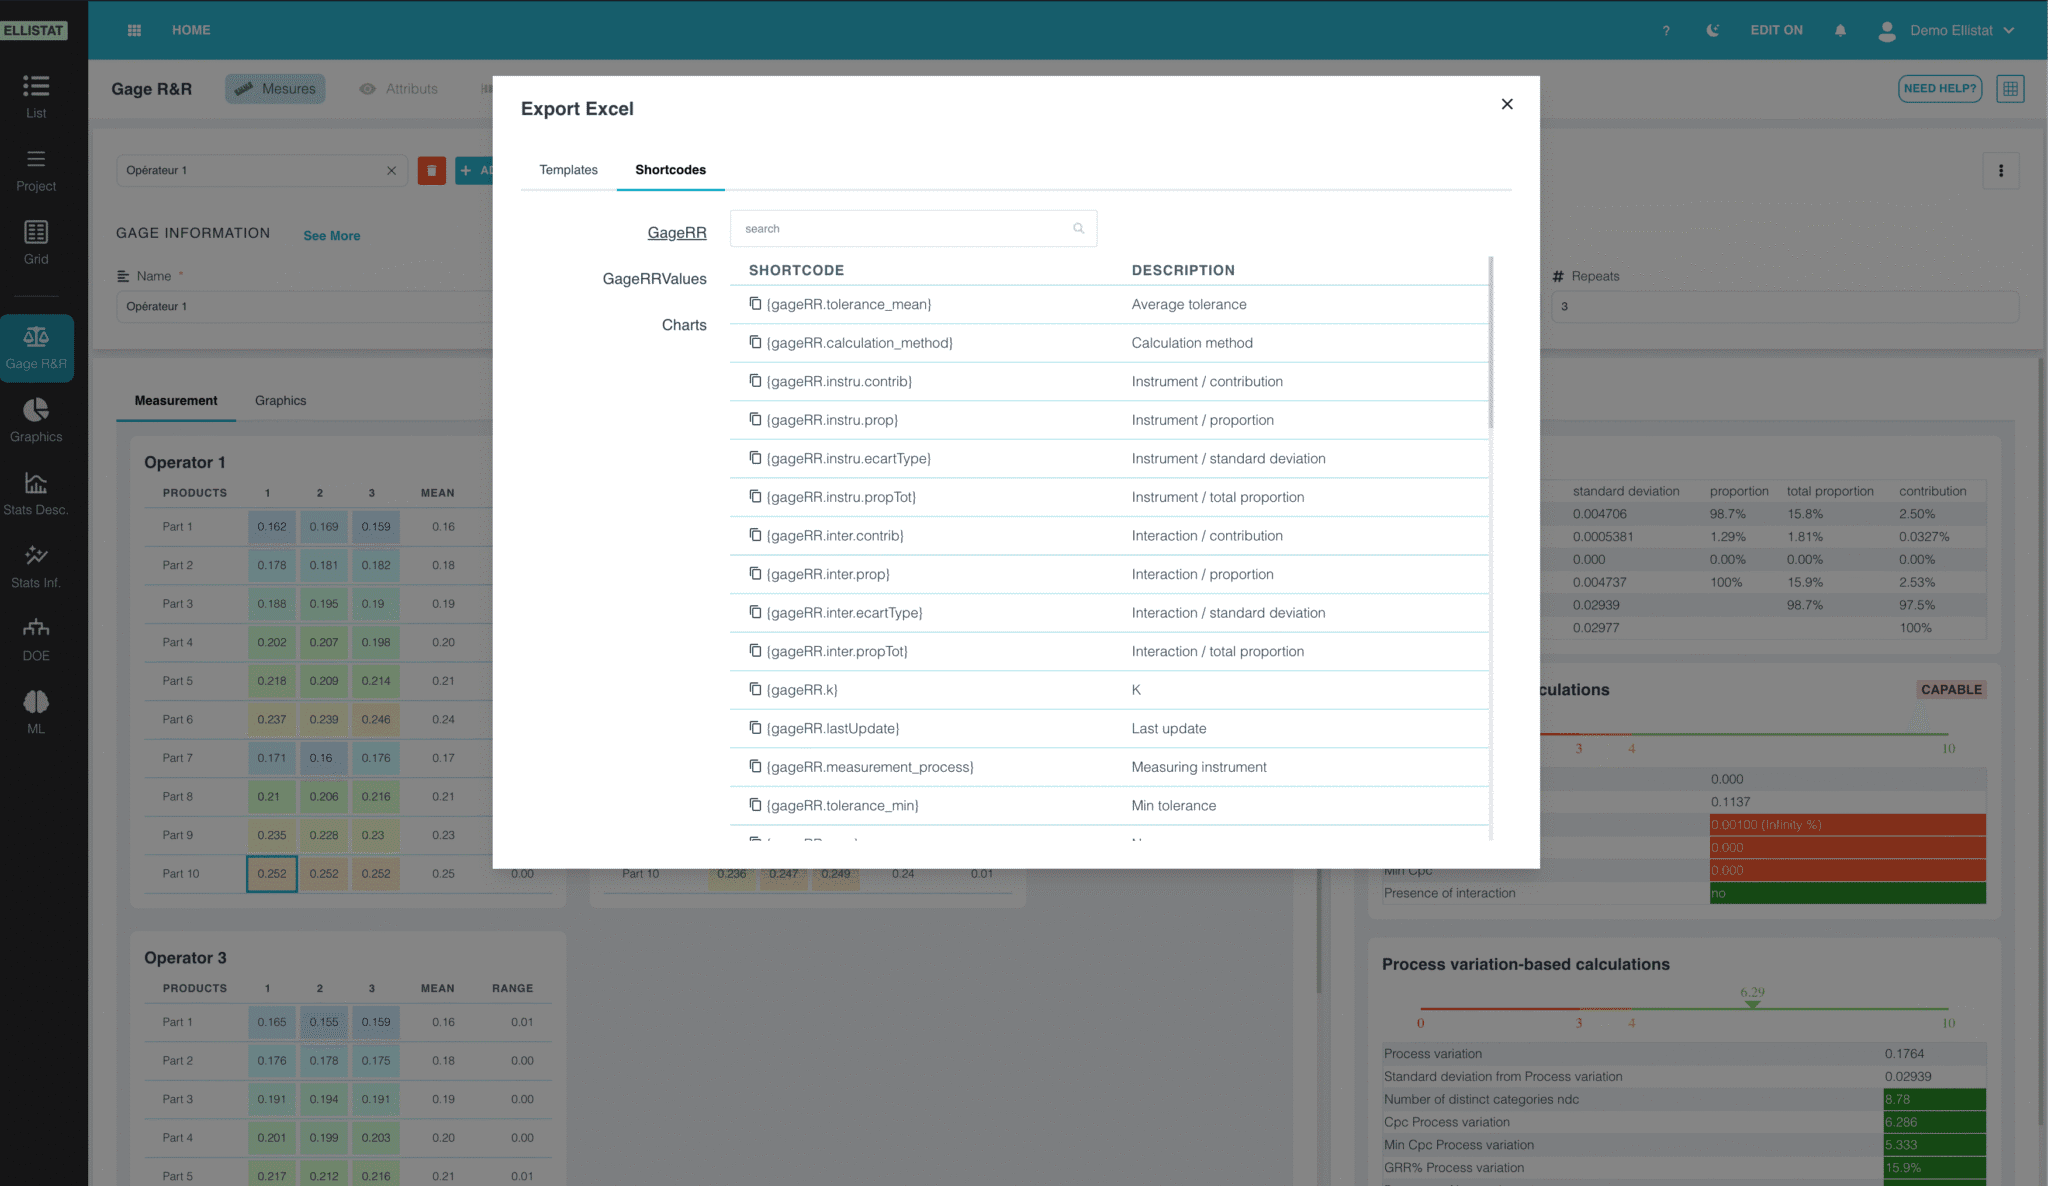
Share your results on a customizable Excel sheet with your customers
Graphs provide visual information on calculation results. This makes it extremely easy to understand malfunctions in a measurement system.
Share your results on a customizable Excel sheet with your customers


Gage R&R attribute
When the measurement gives only a quantitative result, ELLISTAT lets you R&R the attributes and access the results of:
Repeatability: The ability of an operator to agree with itself.
Concordance: Proportion of measurements conforming to the reference measurement. Note that a concordance of 50% corresponds to a random selection of data. You should aim for a concordance of 90%.
Reproducibility: Capacity for an operator to agree with the reference when he agrees with himself.
Export your data for better visualization
This feature allows you to share your results in a clear and personalized way with colleagues or customers.
With just a few clicks, you can transfer your repeatability and reproducibility analyses (Gage R&R) and other statistics directly into Excel spreadsheets, making it easy to interpret and present your data.
With just a few clicks, you can transfer your repeatability and reproducibility analyses (Gage R&R) and other statistics directly into Excel spreadsheets, making it easy to interpret and present your data.
Comprehensive measurement system analysis software
Repeatability and Reproducibility Analysis
(Gage R&R)
- Repeatability calculation ability of an operator to obtain the same results on the same sample under identical conditions.
- Reproducibility calculation ability of different operators to obtain the same results on the same sample.
Data management
- Easy entry and management measurement data
- Data import and export functions, in particular to common formats such as Excel.
Compatibility with standards
- Compliance with MSA standards (Measurement Systems Analysis) to guarantee the validity of results
Customized Reports
- Customizable report generation to document analysis results.
- Options for adding commentsinterpretations and recommendations to the reports.
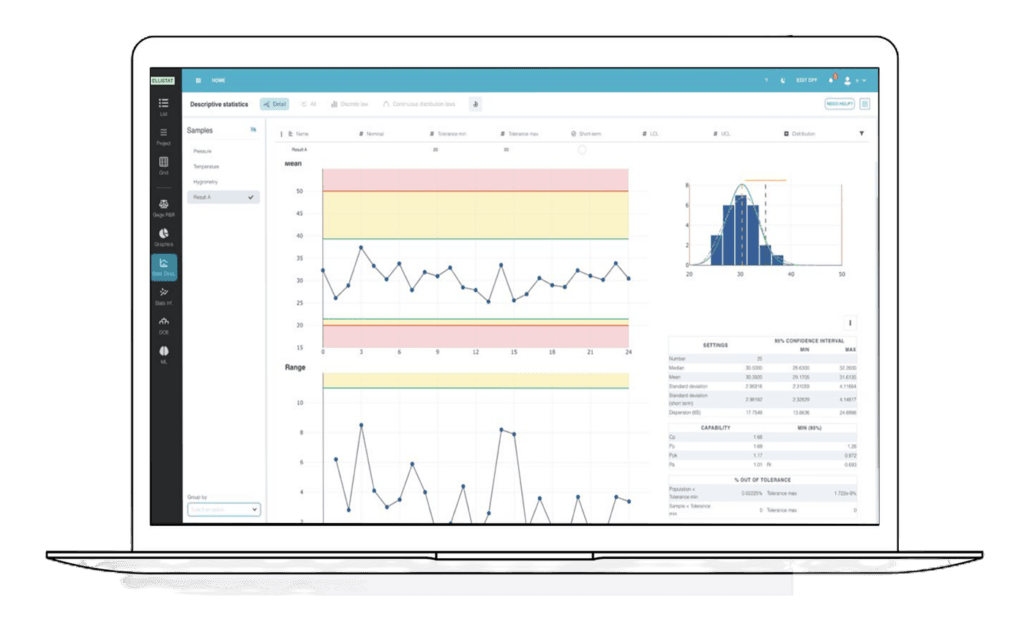
Data visualization
- Graphs and tables to illustrate the results of Gage R&R's analyses.
- Histograms, scatter graphs and control charts to facilitate data interpretation.
Your Feedback

A complete, modular solution
for industry 4.0
6 integrated statistical modules


Try before you buy
- Demonstration15-day trial / 1 year for students0€
- SPC
- Statistical Analysis
- Experimental Design
- MSA
- Graphical Analysis
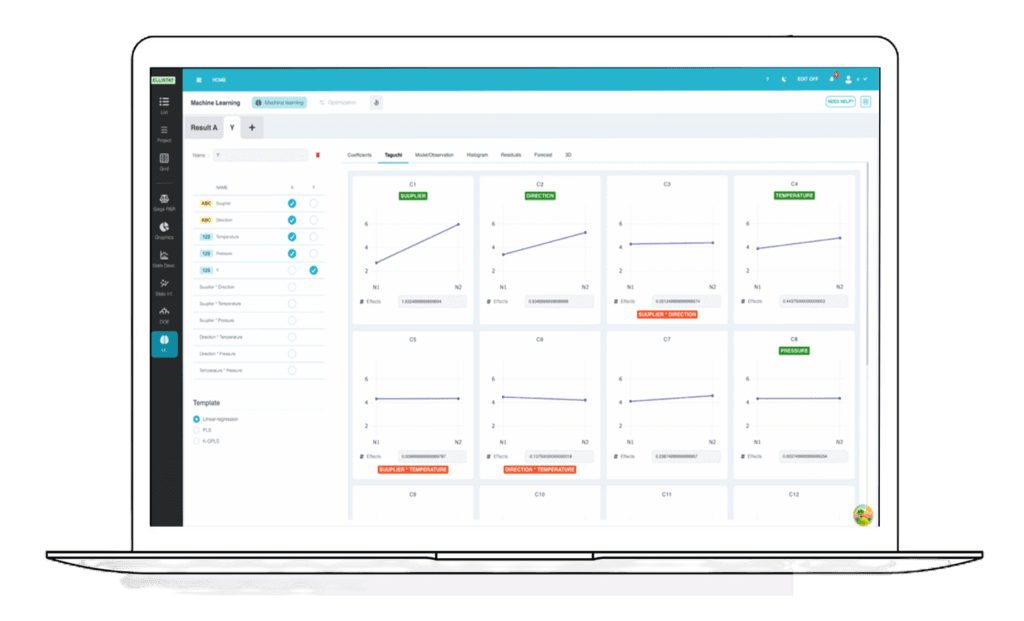
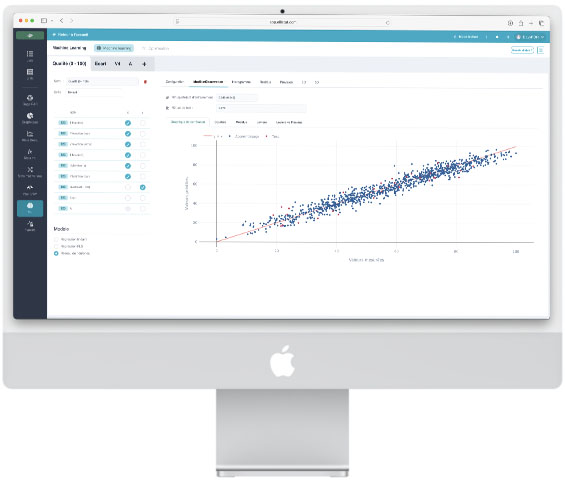
- Machine Learning
- StandardThe best in commitment-free data analysis95€
- SPC
- Statistical Analysis
- Experimental Design
- MSA
- Graphical Analysis
- Machine Learning
- Technical support
- Updates
- Unlimited number of users
- Tacit renewal subscription
- AnnualThe best in data analysis (2 months free)950€
- SPC
- Statistical Analysis
- Experimental Design
- MSA
- Graphical Analysis
- Machine Learning
- Technical support
- Updates
- Unlimited number of users
- Tacit renewal subscription
Read More

Ellistat is enhancing DATA Analysis with AI to improve control over industrial processes
Ellistat is enhancing DATA Analysis with AI to improve control over industrial processes. As an expert in industrial quality, Ellistat ...

Descriptive Statistics in Industry: A Comprehensive Guide
A histogram that's skewed to one side, a control chart that's outside its limits, a supplier that announces...
Statistical Software: Minitab, JMP, or Ellistat—Which One Should You Choose?
Choosing data analysis software for quality and continuous improvement applications is no small matter. Between ...
Data analysis in machining: go from raw data to real quality control
Every machine tool produces data. Measured dimensions, drift frequencies, cutting parameters, calibration results... ...