Capability calculation software
and control cards
Calculate all your capabilities, histograms and control charts in just two clicks
Discover Data AnalysisSoftware for calculating capabilities and control charts
Capability calculation and process monitoring via a control chart is at the heart of industrial statistical analysis. Ellistat speeds up analysis time, takes the guesswork out of complex data, and exports data in a customizable format for your customers.
Test under real conditions
For us, the best way to prove that Ellistat is simple, ergonomic and complete is to let you test it for free for 1 month with your data and with your colleagues!
Ellistat capability calculation and control chart software
Designed to meet specific industry needs
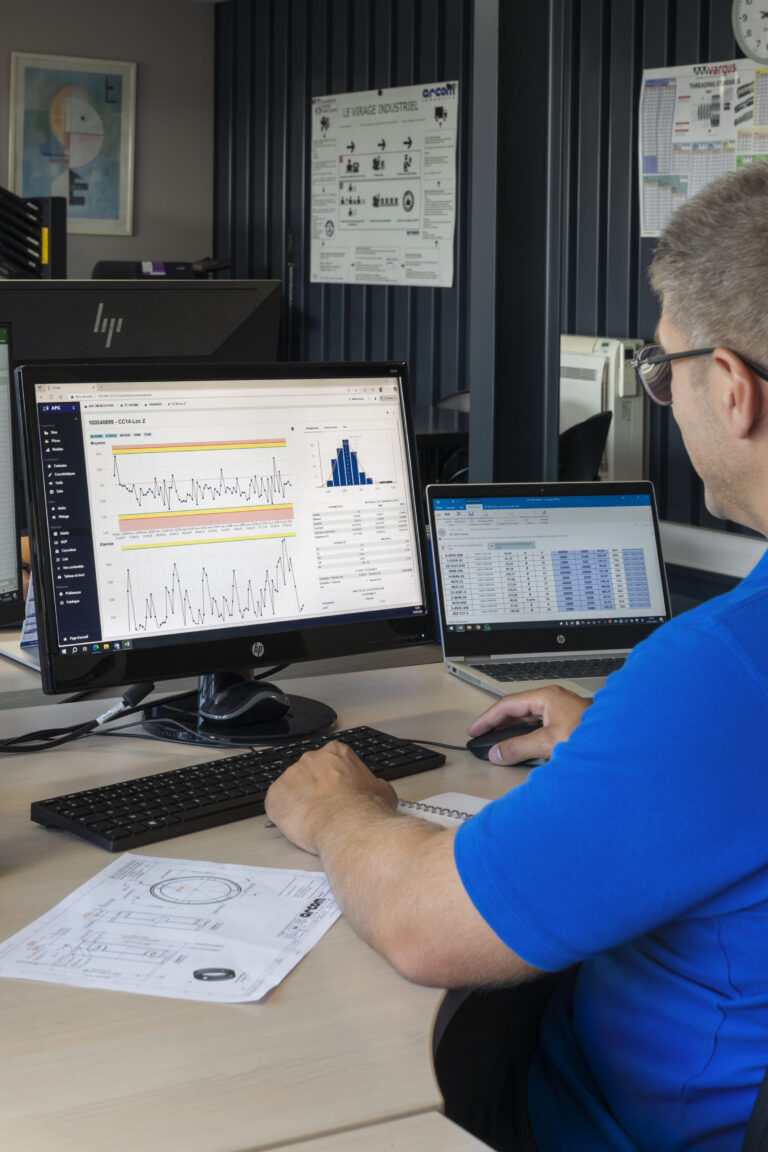
Process Control
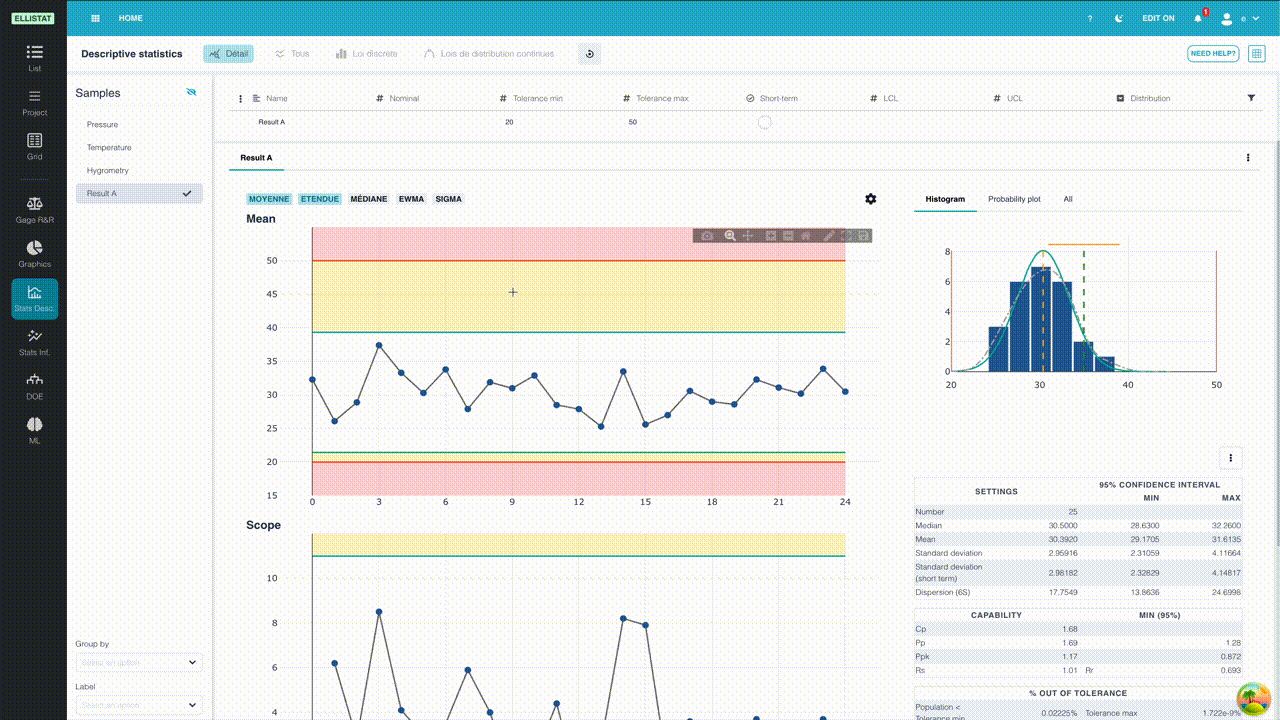
ELLISTAT offers a simple graphical interface for visual display of all your data.
ELLISTAT can do it all, from calculating capability when data is normal or abnormal, to identifying outliers and calculating out-of-tolerance percentages. Finally, if you wish to interpret the chronological evolution of your data, simply plot the control chart to identify drifts over time.


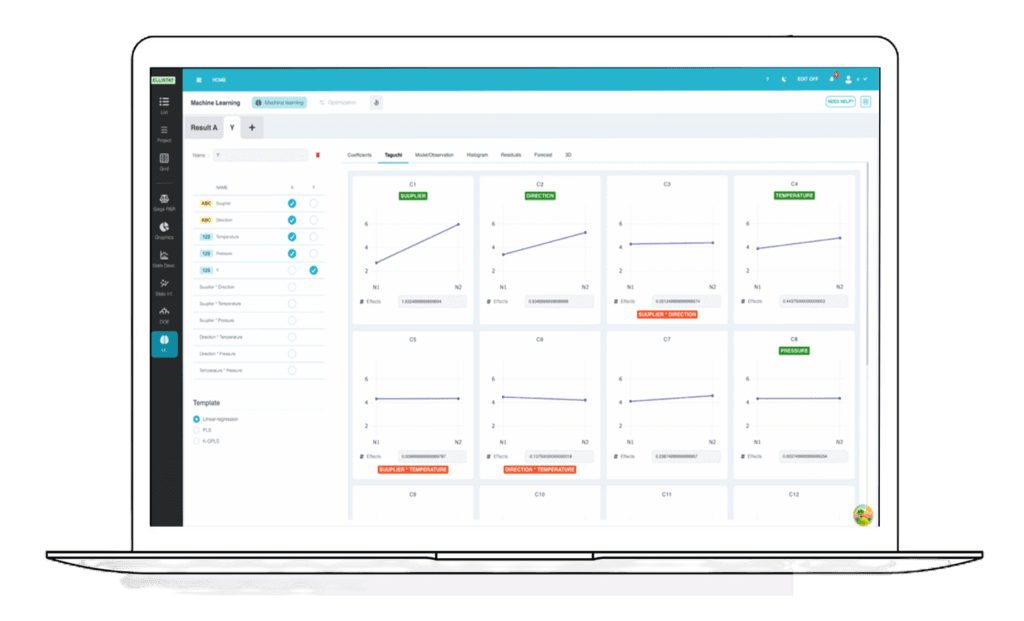
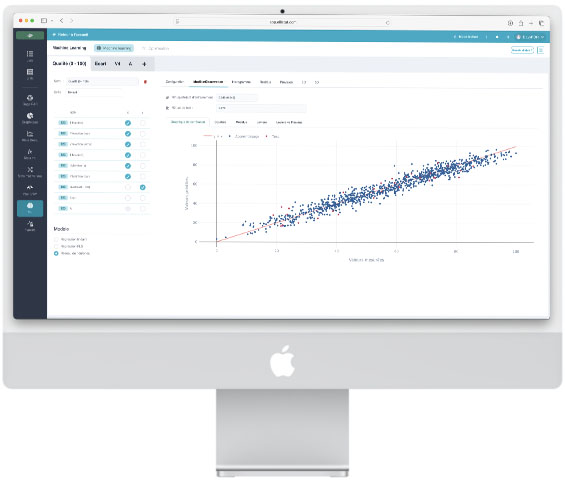
All analyses in one click
You've got multiple ratings and thousands of pieces of data to compile. ELLISTAT will do all the work in a single click.
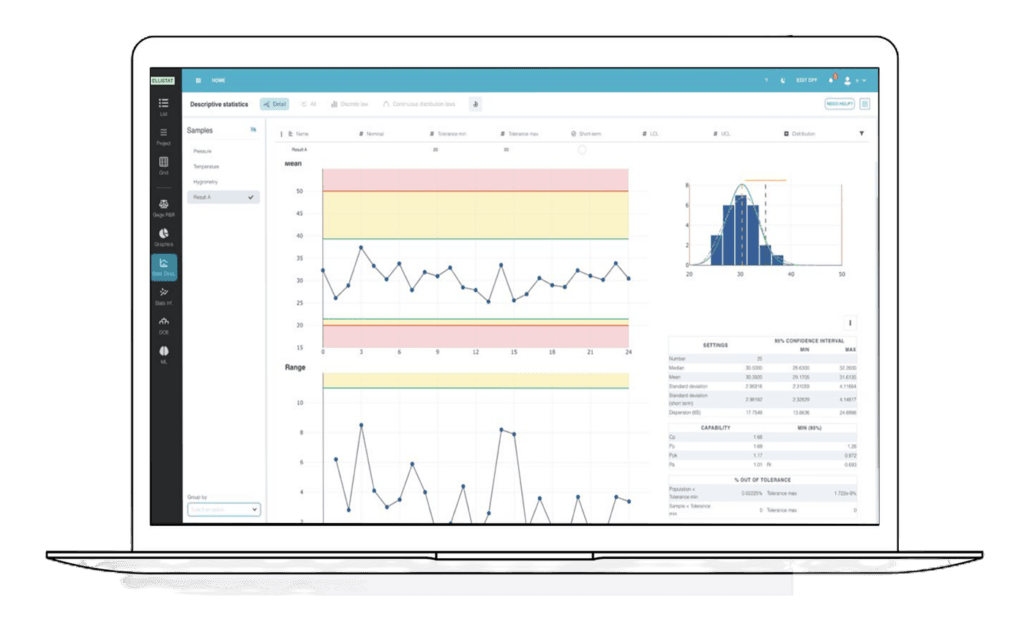
All capability calculations, histograms and control charts are integrated on a single page, giving you a global view of your processes.
Ellistat is a simple yet comprehensive software package for calculating capability and control charts.
All capability calculations, histograms and control charts are integrated on a single page, giving you a global view of your processes.
Ellistat is a simple yet comprehensive software package for calculating capability and control charts.
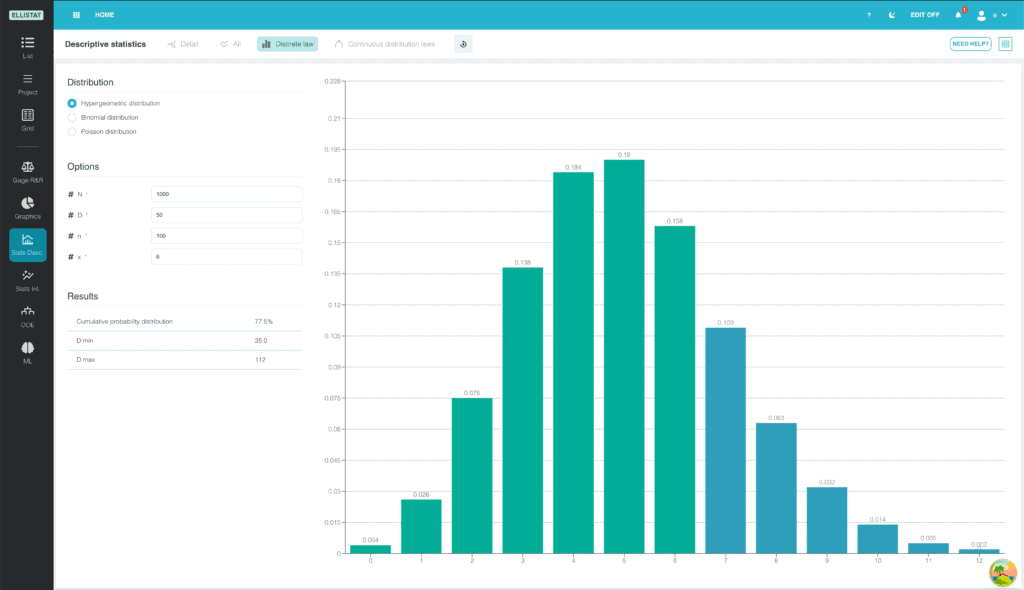
Interpreting attribute data
A supplier used to supplying you with an average of 1% of defects, supplies you with a batch of 100 parts containing 3 defects. Should you be alarmed, or is this finally normal?
To represent this, ELLISTAT provides intuitive graphical tools to better understand how data behaves in all everyday situations.
To represent this, ELLISTAT provides intuitive graphical tools to better understand how data behaves in all everyday situations.
Comprehensive software for calculating capabilities and control charts
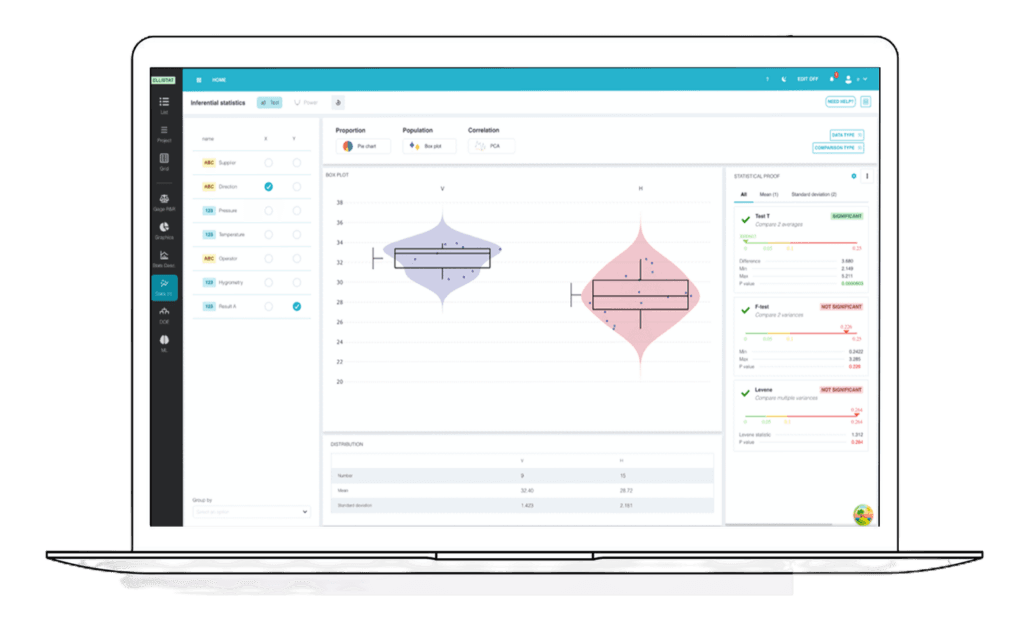
Elementary statistics
- Calculation of mean, standard deviation, median Tools for calculating basic descriptive statistics such as mean, standard deviation and median to summarize data.
Outlier testing
- Identifying outliers Methods for detecting and managing outliers that may affect data analysis.
Confidence Intervals
- Precision estimation : Calculation of confidence intervals to estimate the accuracy of calculated statistics and aid decision-making.
Variable control charts
- Control card types : Support for various types of variable control boards, including X-bar, R, S, X-bar-R, X-bar-S, I, EM, I-EM, I-EM-R/S, zone, Z-EM.
Normal and non-normal capabilities
- Capability analysis Tools for assessing process capability using normal and non-normal distributions
Attribute control charts
- Attribute card types :Control chart support for attributes, including Laney's P, NP, C, U, P' and U'.
Chronological weighted control charts (EWMA)
- Trend monitoring: Use of time-weighted control charts (EWMA) to detect trends and subtle changes in processes.
Multivariate control charts (T2)
- Multivariate analysis Support for T2 multivariate control charts to monitor several variables simultaneously and detect joint variations.
Identifying and modifying the distribution
- Customizing distributions Tools to identify the individual distribution of data and adjust the distribution used in analyses.
Easy navigation between data series
- Quick navigation : Features that make it easy to navigate from one set of data to another with a single click, improving analysis efficiency.
Your Feedback

A complete, modular solution
for industry 4.0
6 integrated statistical modules


Try before you buy
- Demonstration15-day trial / 1 year for students0€
- SPC
- Statistical Analysis
- Experimental Design
- MSA
- Graphical Analysis
- Machine Learning
- StandardThe best in commitment-free data analysis95€
- SPC
- Statistical Analysis
- Experimental Design
- MSA
- Graphical Analysis
- Machine Learning
- Technical support
- Updates
- Unlimited number of users
- Tacit renewal subscription
- AnnualThe best in data analysis (2 months free)950€
- SPC
- Statistical Analysis
- Experimental Design
- MSA
- Graphical Analysis
- Machine Learning
- Technical support
- Updates
- Unlimited number of users
- Tacit renewal subscription
Read More

Descriptive Statistics in Industry: A Comprehensive Guide
A histogram that's skewed to one side, a control chart that's outside its limits, a supplier that announces...
Statistical Software: Minitab, JMP, or Ellistat—Which One Should You Choose?
Choosing data analysis software for quality and continuous improvement applications is no small matter. Between ...
Data analysis in machining: go from raw data to real quality control
Every machine tool produces data. Measured dimensions, drift frequencies, cutting parameters, calibration results... ...
Comparing distributions: Cramér-von Mises test and Energy test
Comparing distributions rather than averages: a key step forward in quality control thanks to ...