Graphic analysis software
Visualize your data
Easily format your data with intuitive software
Discover Data AnalysisTake control of your graphics
Ellistat reverses the problem of graphic formatting
You no longer need to know which chart is the right one, but which data to analyze. Ellistat offers you the right charts, and all you have to do is let us guide you.
You no longer need to know which chart is the right one, but which data to analyze. Ellistat offers you the right charts, and all you have to do is let us guide you.

Test under real conditions
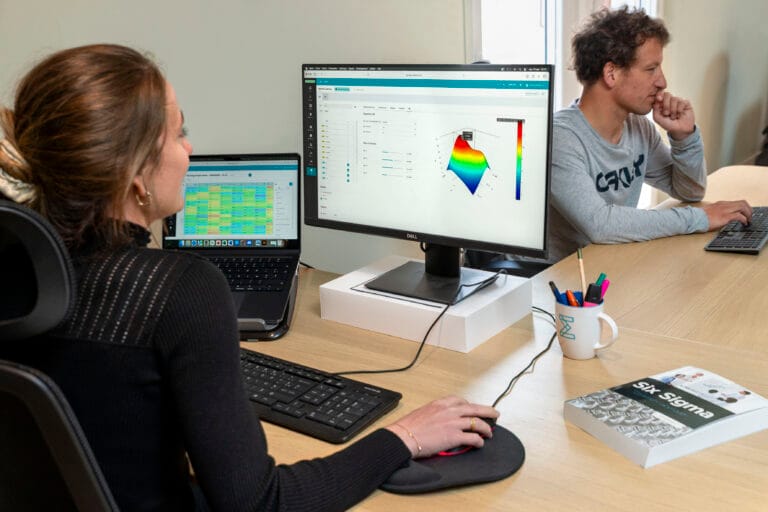
For us, the best way to prove that Ellistat is simple, ergonomic and complete is to let you test it for free for 1 month with your data and with your colleagues!
Ellistat graphical analysis software
Designed to meet specific industry needs
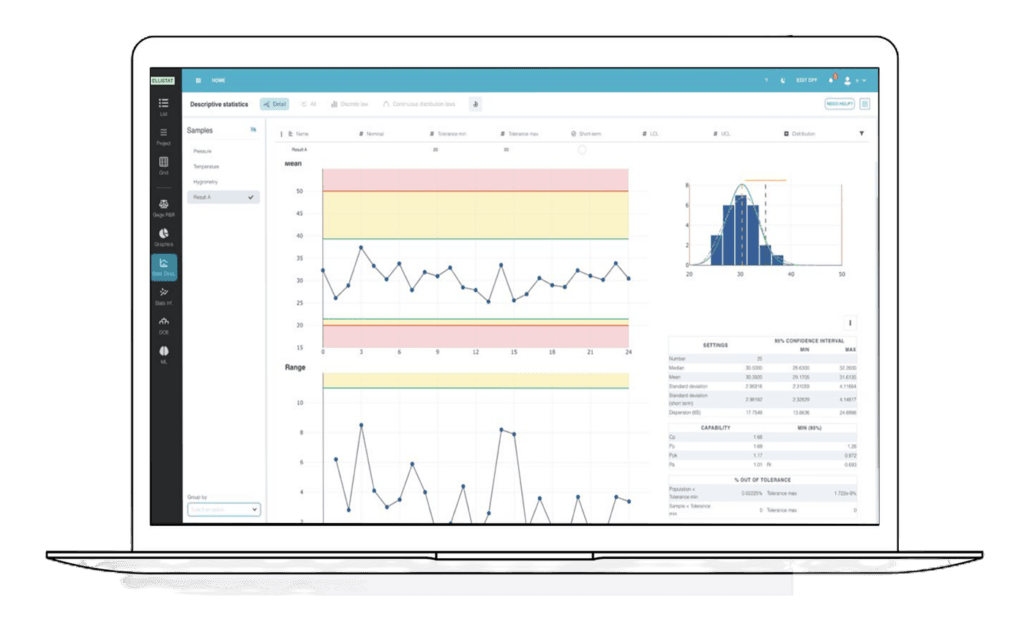
Graphic analysis software
The graphs are updated automatically when data changes. So you can filter the data and see the effect on your graphs straight away.
All our graphics can be customized to share the right information with your employees.
All our graphics can be customized to share the right information with your employees.

Comprehensive graphical analysis software
Point cloud
- Visualizing Correlations Tools for creating scatter plots to examine relationships and correlations between two continuous variables.
Diagonal Matrix Graphics
- Multivariate analysis : Generate diagonal matrix graphs to visualize relationships between several pairs of variables simultaneously.
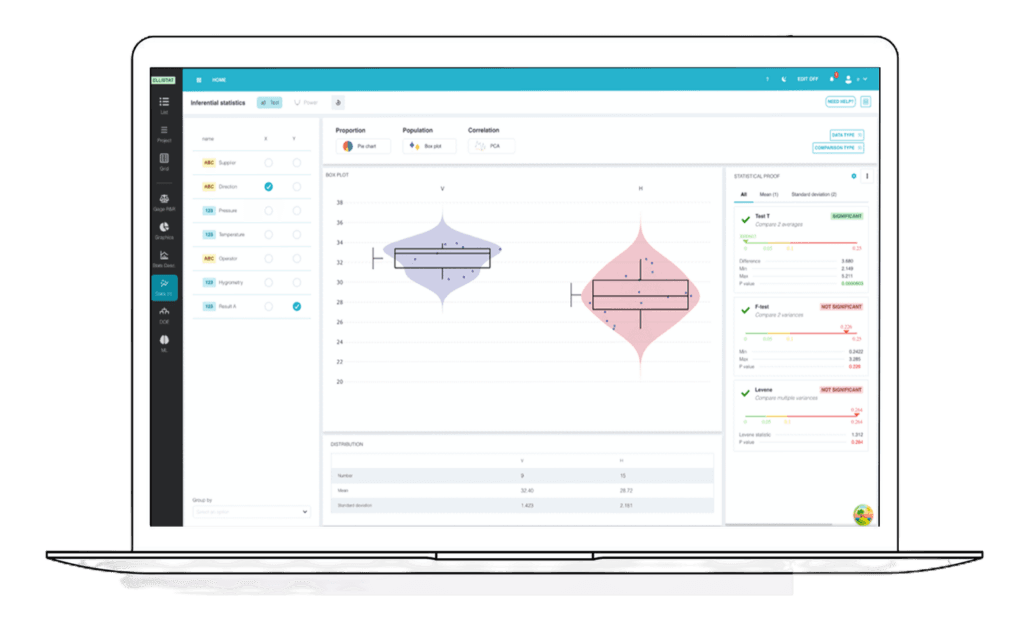
Boxplots
- Visual Statistical Summary Use whisker boxes to display the distribution of data, including median, quartiles and outliers.
Dot Plots
- Frequency representation Create point diagrams to represent data distribution simply and effectively.
Histograms
- Data distribution Construction of histograms to illustrate the frequency of values in a dataset and identify trends and deviations.
Time series diagrams
- Time Analysis Tools for creating time series diagrams, enabling you to track data variations over time.
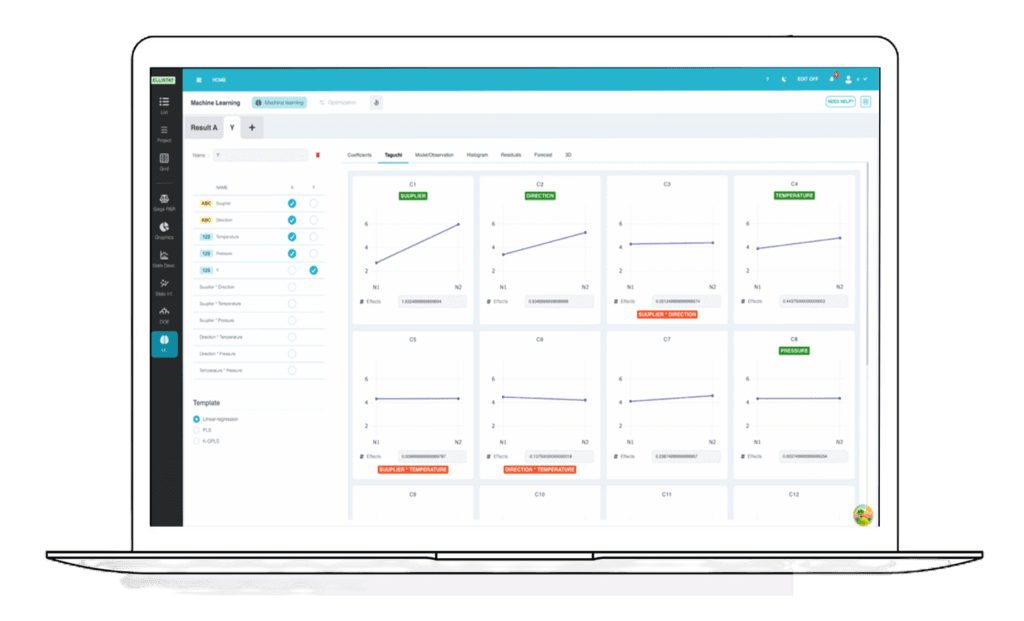
Linear regression
- Linear Relationship Modeling : Linear regression functions, to model and predict the relationship between a dependent variable and one or more independent variables.
Statistical evidence
- Model Validation Tools to provide statistical evidence such as p-values, confidence intervals and hypothesis testing to validate models and analyses.
Your Feedback
A complete, modular solution
for industry 4.0
6 integrated statistical modules


Try before you buy
- Demonstration15-day trial / 1 year for students0€
- SPC
- Statistical Analysis
- Experimental Design
- MSA
- Graphical Analysis
- Machine Learning
- StandardThe best in commitment-free data analysis95€
- SPC
- Statistical Analysis
- Experimental Design
- MSA
- Graphical Analysis
- Machine Learning
- Technical support
- Updates
- Unlimited number of users
- Tacit renewal subscription
- AnnualThe best in data analysis (2 months free)950€
- SPC
- Statistical Analysis
- Experimental Design
- MSA
- Graphical Analysis
- Machine Learning
- Technical support
- Updates
- Unlimited number of users
- Tacit renewal subscription
Read More
Data Analysis: powerful statistical analysis software
"With Data Analysis, you don't need to be a quality expert to analyze production data. Its simplicity ...

Process control: AI can work wonders
Artificial intelligence is transforming the industry, but deploying it requires method, reliable data and a clearly defined strategy, says ...

Minitab vs Ellistat?
Minitab vs Ellistat? Choosing a statistical analysis software package can sometimes prove difficult. Minitab is often associated with ...

What should I do if I get a bad Cpc?
What is Cpc: Cpc stands for Control Process Capability. It is used to identify a control process ...