SPC or MSP? What's the point?
SPC (Statistical Process Control) is a method of statistical control of processes. quality control which continuously monitors production processes using data collected in real time.
This is undoubtedly one of the oldest quality methods. Over the decades that it has been applied, it has now reached an extraordinary level of maturity, giving it unrivalled efficiency. In many industries, such as the automotive, aerospace and luxury sectors, a product is either of high quality or it is not. To achieve this quality, it is necessary to use tools and methods such as SPC (Statistical Process Control).
SPC and control cards
Using statistical tools such as control cardsSPC (Statistical Process Control) is used to identify deviations from quality standards before they become major problems. This enables corrective action to be taken before defective products are produced in large quantities. In the machining sector, APC (Automated Process Control) allows machine tools to be corrected before drifts are observed.
By reducing defects and variations, SPC (Statistical Process Control) helps reduce the costs associated with rejects, rework and product recalls. In other words, SPC reduces costs for the company. SPC is a fundamental pillar for any company seeking to achieve operational excellenceThis enables us not only to maintain high quality standards, but also to proactively optimize production processes.
SPC: a little history
The application of statistics in production is nothing new. Almost a century old, the application of SPC is based on two basic concepts:
- monitoring and control using "control cards
- measuring and monitoring capabilities
These two pillars of SPC were not introduced at the same time. Control charting was introduced as early as the 1930s thanks to the work of Shewhart. On the other hand, capability measurements were only formalized and accepted in the 1970s, mainly in the American automotive industry.
Japanese industry has been making intensive use of statistical tools for over thirty years. It was under the impetus of Dr. W Edwards Deming, an American consultant to Japan, that statistical methods were first introduced and then applied to production. In Europe, despite some remarkable applications here and there, we made very little use of statistical tools in our manufacturing workshops until the early 1980s. FORD was undoubtedly one of the leaders in the modern worldwide promotion of SPC.
How to use SPC to control a process
Mastering a process means mastering its variations over time. Indeed, during the use of a process, many factors will modify its condition (tool wear, material changes, operator changes, etc.). This is bound to have an impact on the centering and variability of the process. It is for this reason that the process is adjusted at the start of production to be as close as possible to the target.
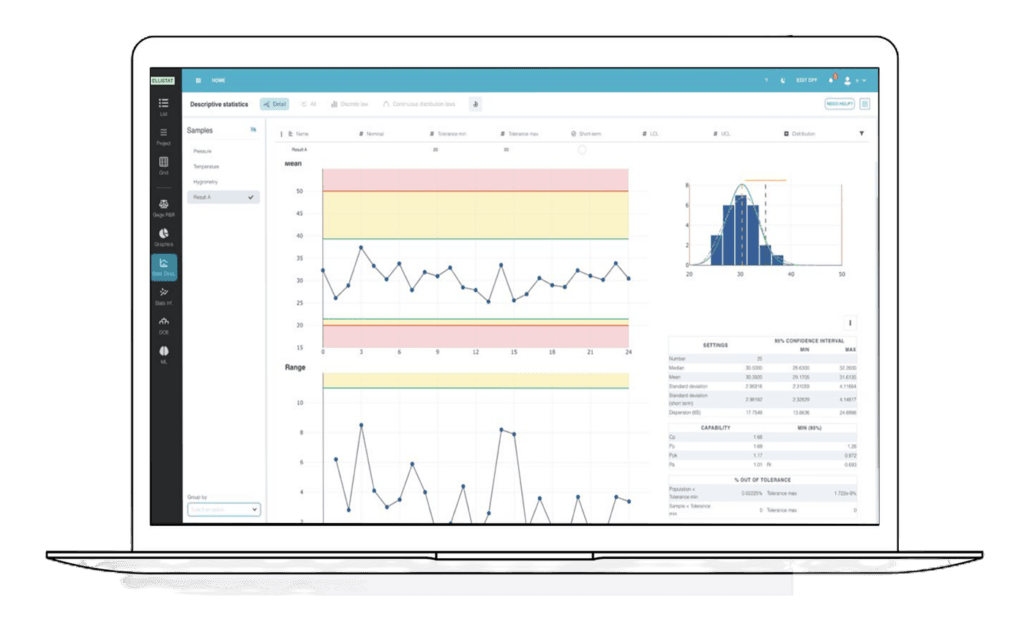
To enable us to adjust a machine to just what is needed, we use control charts. The control chart is a tool for monitoring the evolution of a process over time, and reacting if a deviation in centering or dispersion is detected.
When setting up a process, there are two pitfalls to avoid:
- Over-adjustment: over-adjustment occurs when the process is adjusted too often. In fact, centering the process does not mean that all parts must be on target: the parts will never all be centered, due to the dispersion of the process.
- Process drift: the process we're controlling will drift over time due to a number of special factors (tool wear, operator changes, process intervention, etc.), and we need to be able to refocus the process if drift is detected.
The control card is therefore the most suitable tool.
Individual values card
The principle used when monitoring a process using a control chart is that of Shewart :
We assume that the process is perfectly centered and that the only possible variation is due to short-term process variations. If the process is indeed perfectly centered, then 99.7% of parts will be produced within the process dispersion, i.e. +/- 3σ in the case of a normal distribution. The limits defined in this way are called control limits.
When producing a part, two cases can arise:
- Within the control limits: when a part is measured and found to be within the control limits, the hypothesis of a perfectly centered process is verified: there's nothing to be done.
- Outside the control limits: when a part is measured and found to be outside the control limits, the assumption of a perfectly centered process is no longer valid: the process must be adjusted.
Conclusion
SPC is older than our grandparents, and yet it is still relevant today. The concepts developed to control processes bring substantial gains in terms of process variability and therefore production quality. Today, unlike in the 80s when SPC first appeared in Europe, control charts are calculated by specialized software, and alerts can be sent back to the workshop in real time. The theory remains the same, but the tools are becoming more digital.