Machine Learning software
Model your data
Discover what lies behind your data using powerful statistical tools
Machine Learning: model your data
Understanding a process means being able to predict its results, to put the process into the form Y = f(X). With Ellistat, you can analyze several Ys simultaneously, and optimize responses from different models.

Test under real conditions
For us, the best way to prove that Ellistat is simple, ergonomic and complete is to let you test it for free for 1 month with your data and with your colleagues!
Ellistat Machine Learning software
Designed to meet specific industry needs
Machine learning just a click away
Modeling your data has never been easier.
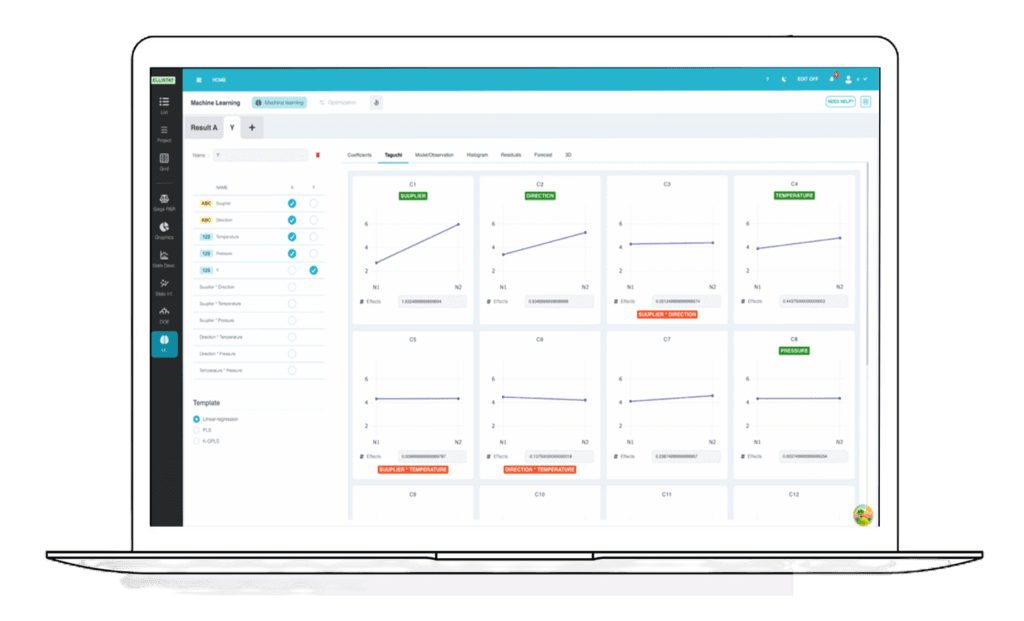
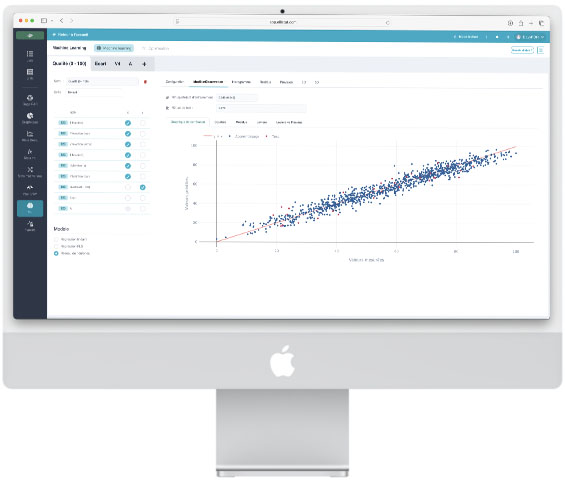
1. Choose the type of model to be used: linear regression, decision tree, PLS, neural network, etc...
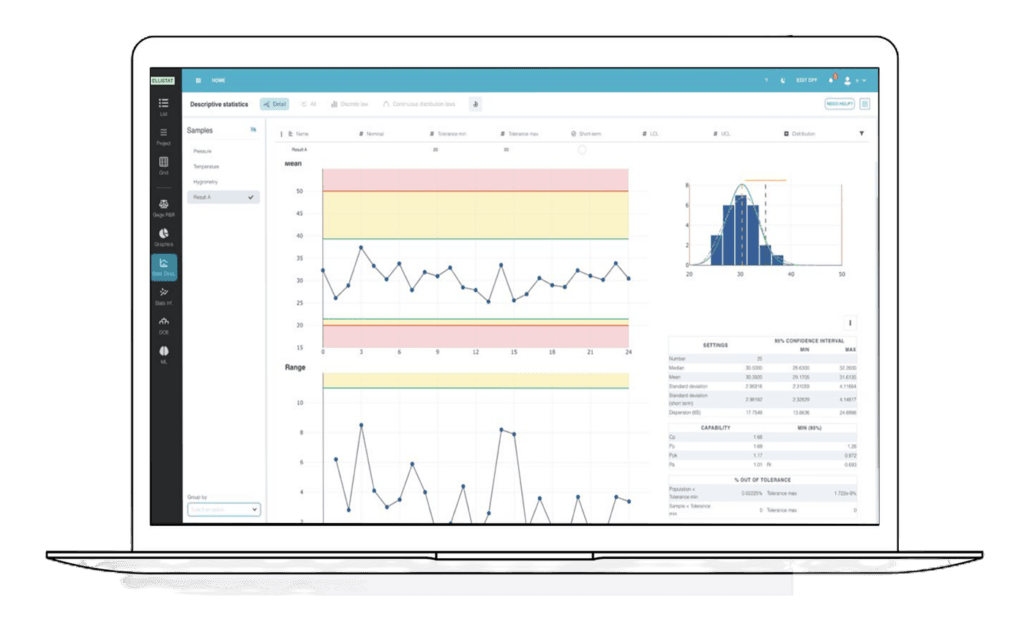
2. Validate the model using the graphical tools provided. All analyses can be accessed directly from the user interface to help you understand your data.
3. Optimize your results with our forecasting tools
1. Choose the type of model to be used: linear regression, decision tree, PLS, neural network, etc...
2. Validate the model using the graphical tools provided. All analyses can be accessed directly from the user interface to help you understand your data.
3. Optimize your results with our forecasting tools


Multi-models
Ellistat lets you optimize quantitative and qualitative responses with the same tool.
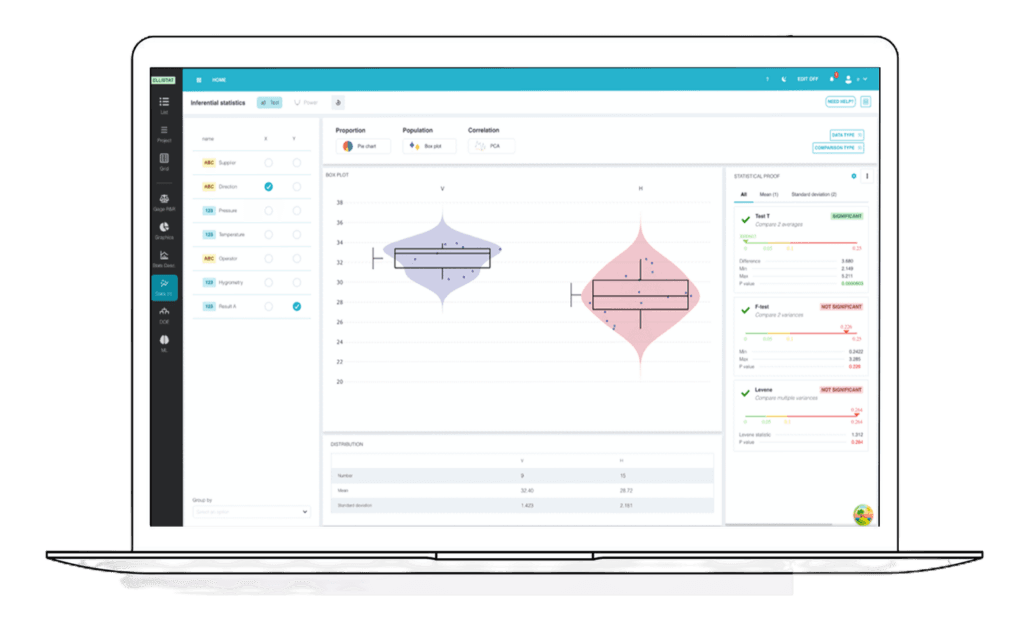
The software features powerful visualization tools, making it easy to create clear, informative graphs and tables, which facilitate the interpretation of results.
The software features powerful visualization tools, making it easy to create clear, informative graphs and tables, which facilitate the interpretation of results.
Complete Machine Learning software
Automatic Model Proposal
- Data-driven selection The software automatically suggests the most appropriate models based on the characteristics of the data supplied.
Linear and non-linear regression
- Relationship Modeling Use linear and non-linear regression methods to model relationships between independent and dependent variables.
Logistic regression
- Binary, Nominal and Ordinal: Logistic regression support for binary, nominal and ordinal outcomes, allowing different types of categorical data to be processed.
Graphics and Data Visualization
- Chart types Generate factorial, residual, contour, surface and other graphs to visualize analysis results and relationships between variables.
PLS (Partial Least Squares)
- PLS Regression Analysis Use of partial least squares for regression models, useful when the predictors are numerous and collinear.
Best sub-assemblies
- Variable selection Identifying the best subsets of explanatory variables to build simpler, more efficient models.
Response Optimization and Prediction
- Predictive Modeling Optimization of models to predict future responses and results based on existing data.
Your Feedback
A complete, modular solution
for industry 4.0
6 integrated statistical modules


Try before you buy
- Demonstration15-day trial / 1 year for students0€
- SPC
- Statistical Analysis
- Experimental Design
- MSA
- Graphical Analysis
- Machine Learning
- StandardThe best in commitment-free data analysis95€
- SPC
- Statistical Analysis
- Experimental Design
- MSA
- Graphical Analysis
- Machine Learning
- Technical support
- Updates
- Unlimited number of users
- Tacit renewal subscription
- AnnualThe best in data analysis (2 months free)950€
- SPC
- Statistical Analysis
- Experimental Design
- MSA
- Graphical Analysis
- Machine Learning
- Technical support
- Updates
- Unlimited number of users
- Tacit renewal subscription
Read More

Descriptive Statistics in Industry: A Comprehensive Guide
A histogram that's skewed to one side, a control chart that's outside its limits, a supplier that announces...
Statistical Software: Minitab, JMP, or Ellistat—Which One Should You Choose?
Choosing data analysis software for quality and continuous improvement applications is no small matter. Between ...
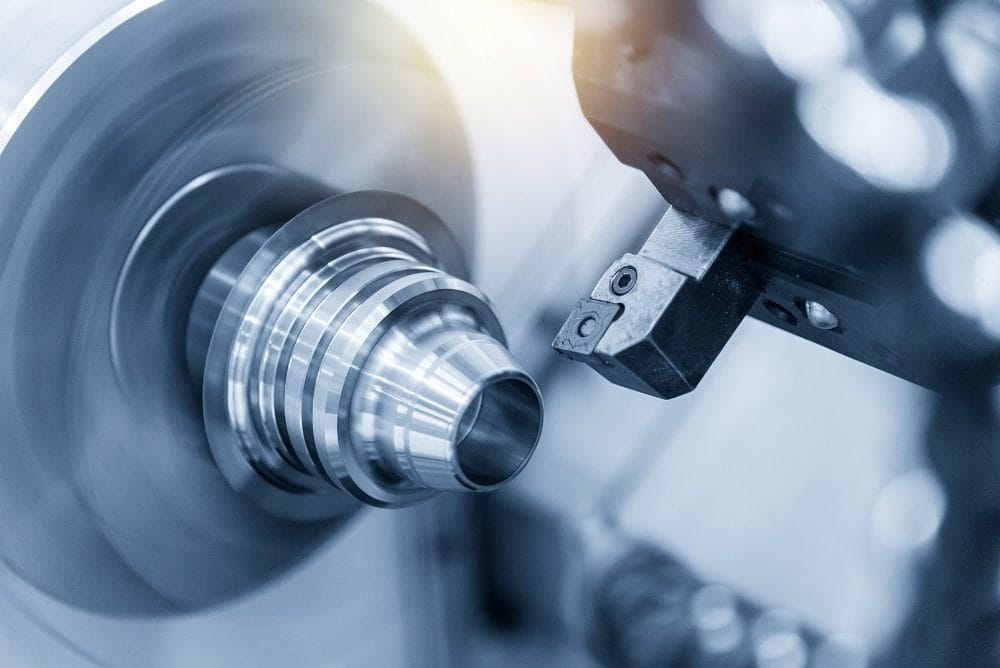
Data analysis in machining: go from raw data to real quality control
Every machine tool produces data. Measured dimensions, drift frequencies, cutting parameters, calibration results... ...
Comparing distributions: Cramér-von Mises test and Energy test
Comparing distributions rather than averages: a key step forward in quality control thanks to ...