


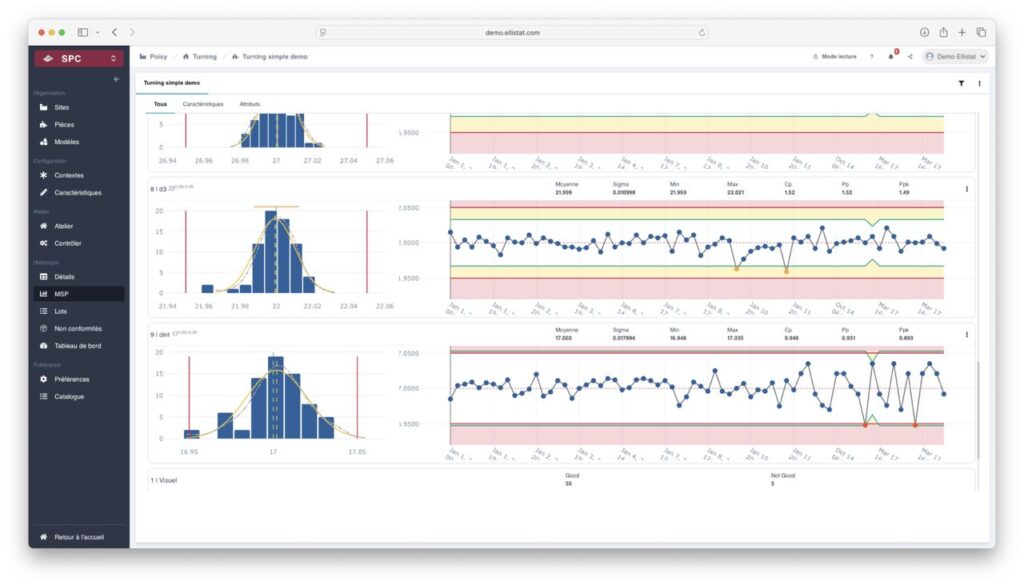
X̄-R Control Chart: What Are the Red Lines For?
On an X̄-R control chart, operators see dots, blue lines, and—often a source of questions—red lines framing the graph. These lines are neither arbitrary thresholds nor production targets: they are the very heart of the statistical reasoning that allows us to distinguish normal variation from a genuine warning signal. Understanding their significance means understanding why statistical process control (SPC) remains, decades after its invention by Walter Shewhart, one of the most powerful tools in quality control.
What the red lines represent
The red lines on an X̄-R map have specific names: control limits (in English control limits). We distinguish between the LCS (upper control limit) and the LCI (lower control limit). They flank the centerline, which represents the overall process mean (X̄ on the mean chart) or the mean of the ranges (R̄ on the range chart).
These limits are calculated based on data from the process itself—not imposed from outside. The standard formula is:
LCS = X̄ + A₂ × R̄
LCI = X̄ − A₂ × R̄
where A₂ is a tabulated coefficient that depends solely on the size of the subgroup (n). This coefficient accounts for the relationship between the mean range and the standard deviation of the process. Result: The control limits are statistically set at ±3 standard deviations from the mean, which corresponds to a probability of exceeding the limits of approximately 0.27 % when the process is stable.
Control Limits vs. Specifications: A Common Source of Confusion
The most common mistake is to confuse control limits with specification limits (or tolerances), which sometimes appear on the same charts as green or black lines. Tolerances represent what the customer accepts; control limits represent what the process naturally produces.
A process may very well be under statistical control (no points outside the red lines) while producing parts that are out of specification—this is the case with a process that is centered but too dispersed. Conversely, a process may be out of control (points that extend beyond the red lines) while remaining within tolerance limits—which means that a specific cause is disrupting the system, even if the consequences are not yet visible in the parts' conformance.
Mixing these two concepts leads to two types of costly errors: unnecessarily intervening in a stable process (what Deming called the tampering), or overlook an actual deviation because the parts still appear to be in compliance.
How are control limits calculated in practice?
The calculation is based on a implementation phase (Phase 1), during which a minimum of 20 to 25 representative subgroups are collected from a process considered stable. Based on this data:
- We calculate the mean and range (maximum value − minimum value) for each subgroup.
- We calculate X̄ (the mean of the means) and R̄ (the mean of the ranges).
- The formulas are applied using the coefficients A₂, D₃, and D₄ appropriate for the size n of the subgroup.
- We check retrospectively to ensure that no data point from Phase 1 exceeds the calculated limits. If any do, we identify the cause, exclude the affected subgroups, and recalculate.
Once the limits have been validated, they are frozen for the monitoring phase (Phase 2). This is an important rule: the limits are not recalculated continuously, because that would be equivalent to letting the process define its own rules at each new data point.
Interpreting a Red Line Breach
When a data point falls outside the control limits, the chart indicates a special cause variation—an event that is not part of the process’s normal variability: a change in raw material batch, tool wear, operator error, temperature variation, etc. The response must be immediate: identify the cause, document it, and, if possible, correct it before resuming production.
X̄-R cards also include additional detection rules (Nelson's or Western Electric's rules), which make it possible to detect subtle signals even without crossing the red lines: eight consecutive points on the same side of the centerline, a monotonic trend over six points, etc. These rules increase detection sensitivity, at the cost of a slight increase in false alarms if they are all activated simultaneously.
The red lines on an X̄-R chart are not merely a graphical embellishment: they represent the voice of the process. Knowing how to interpret them correctly—by distinguishing them from customer specifications and responding appropriately to the signals they convey—is the fundamental skill that transforms a simple set of measurements into a true quality control tool.