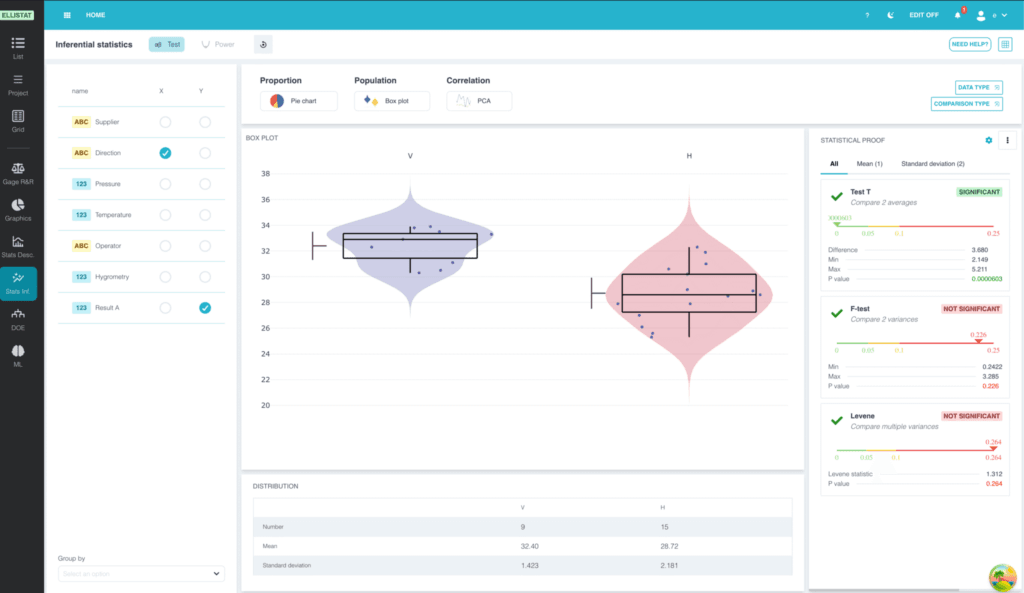
Before going into the details of parametric and non-parametric tests, let's recall how a statistical test works. The Ellistat Data Analysis module allows you to perform these tests.
A statistical test works as follows:
- We consider a null hypothesis in which there is no difference between the samples.
- We calculate the probability of falling into the same configuration as that obtained with the samples observed following the null hypothesis. This probability is known as the "alpha risk" or "p-value".
- If alpha risk < 5%, it is considered too unlikely to obtain such a configuration under the null hypothesis. We therefore reject the null hypothesis and consider the difference between the samples to be significant. For this reason, all the statistical test results proposed by Ellistat will be associated with an alpha risk value on the following scale:

The number below the scale is equal to the alpha risk of the test:
- If alpha risk < 0.01, the difference is considered highly significant<.
- If alpha risk < 0.05, the difference is considered significant.
- If alpha risk < 0.1, the difference will be considered borderline (we can't say there's a significant difference, but the hypothesis is interesting).
- If alpha risk > 0.1, the difference is considered insignificant.
Example
To illustrate how a statistical test works, let's take the following example.
Suppose we want to detect whether a coin has been tipped by flipping a coin. We assume that the coin always lands on tails.
Throw n°1
After the first toss, the coin lands on tails. Can we deduce from this that the coin has been tipped?
On the face of it, it would be rather risky to bet that the part is piped, as it could very well have happened with a standard part.
In this case, the null hypothesis is: the coin is not tipped, so it has a 50/50 chance of coming up heads or tails. The probability of an unpiped coin landing on tails is 50%.
Therefore, the probability of obtaining tails after the first toss of an unpiped coin is 50%, so the alpha risk of the test is:Alpha risk = 50%
That is, there is a 50% chance of obtaining the same result by following the null hypothesis.
Throw n°2
After the second toss, the coin lands on tails again. The alpha risk becomes:Alpha risk = 25%
Does this mean that the coin is a dud?
The question then arises: at what alpha risk can we say that the coin has been tipped?
As a general rule, in industry, the alpha risk limit is set at 5%.
In other words:
- If alpha risk < 5%, the null hypothesis is rejected and the coin is considered to be tipped.
- If alpha risk > 5%, we can't say that the coin is piped. However, this does not mean that the coin is not piped, as this depends on the number of throws made.
Example continued
Let's continue our example:
-3ème toss, coin lands on tails: alpha risk = 12.5%
-4ème toss, coin lands on tails: alpha risk = 6.75%
-5ème Coin toss: Alpha risk = 3.375%
In this case, from the 5thème We can therefore say that the coin is tipped with a risk of less than 5%.
Parametric vs. non-parametric tests
When making population comparisons, or comparing a population with a theoretical value, there are two main types of test: parametric and non-parametric.
Parametric tests
Parametric tests work on the assumption that the data we have available follows a known type of distribution law (usually the normal law).
To calculate the alpha risk of a statistical test, simply calculate the mean and standard deviation of the sample to access the sample's distribution law.

With the distribution law perfectly known, we can calculate the alpha risk based on the theoretical calculations of the Gaussian distribution.
These tests are generally very fine, but they require that the data actually follow the assumed distribution law. In particular, they are very sensitive to outliers and are not recommended if outliers are detected.
Non-parametric tests
Non-parametric tests make no assumptions about the distribution of the data. They are based solely on the numerical properties of the samples. Here's an example of a non-parametric test:
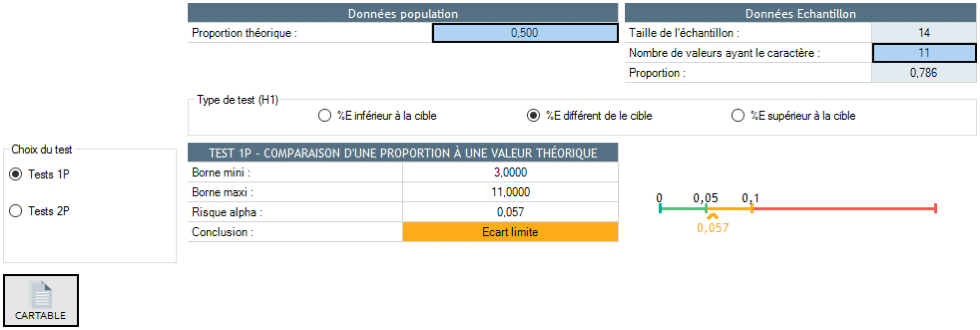
We want to check that the median of a population is different from a theoretical value. We measure 14 pieces and obtain the following sample:

11 times on the same side out of 14
11 times out of 14, the result is below the theoretical median. If the median of the population is equal to the theoretical value, we should have 50% of coins above the median and 50% of coins below. To determine the significance of the deviation of the median from the theoretical median, it is therefore sufficient to check whether the frequency of 11 times out of 14 is significantly different from 50%.

This gap is borderline.
As in the previous example, non-parametric tests do not need to assume a particular type of distribution to calculate the alpha risk of the test. They are very elegant and based on numerical properties. What's more, they are not very sensitive to outliers and are therefore recommended in this case.

