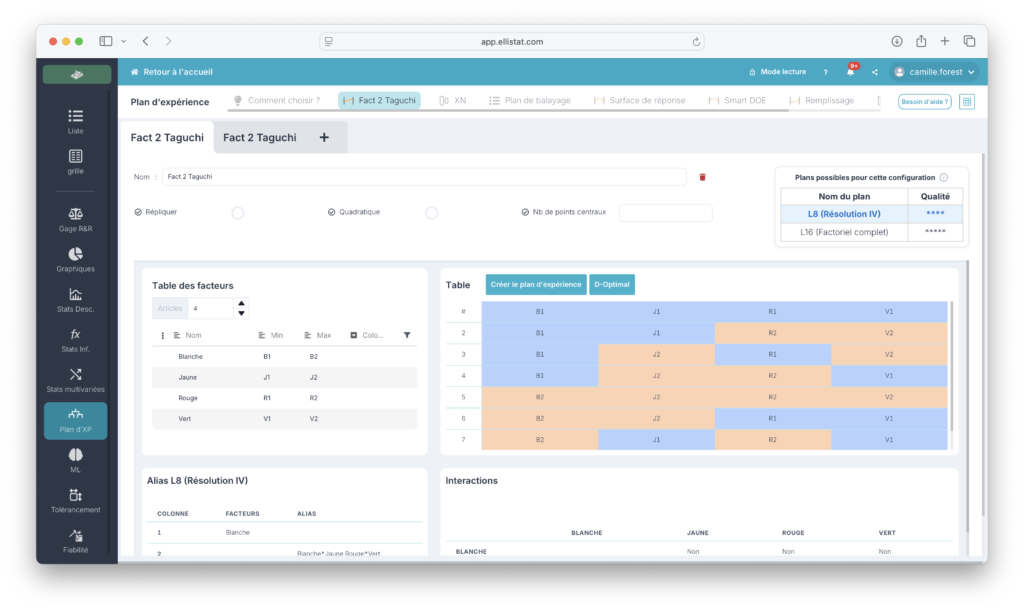
Taguchi's experimental design is a statistical method used to improve the quality of products and manufacturing processes. Developed by the Dr. Genichi Taguchi The aim of this plan is to identify the most influential factors in the variation of a product or process, while minimizing the number of experiments required.
This method organizes experiments systematically and efficiently, enabling the effects of several variables to be analyzed simultaneously. The main objective is to make the product or process robust against external and internal variations, thus ensuring stable, high-quality performance.
Building an experimental design - Taguchi method
Defining factors and levels
Defining the factors involves selecting the factors to be studied. To select the right factors, we recommend that you first understand the process or product concerned, and then carry out the following steps:
- Organize brainstorming sessions with a multidisciplinary team to generate an exhaustive list of potential factors.
- Assess the importance of each factor in terms of its potential impact on the final result. Prioritize factors likely to have a significant effect.
- Select the factors relevant to the experimental design according to the importance of the factor, your ability to control it, and the ease of measuring it reliably.
For each factor identified, we then need to define the levels studied. It is important to choose the right levels:
- Beach width Select levels that cover a sufficiently wide range to detect the effects of factors, but without going to unrealistic extremes that could be unnecessary or dangerous.
- Practical To ensure that the levels selected are achievable in a real-life production context.
Table selection
Once the factors have been identified, you need to create the experimental design. To do this, we recommend using Ellistat's Data Analysis module which features an exclusive experiment design engine. It is capable of finding a design with the best possible strategy given a given structuring of interactions. The tables programmed in Ellistat are L4, L8, L12, L16, L20 and L32.
Here are the elements to take into account when creating your experimental design according to Taguchi's methodology:
Notion of interaction
A*B interaction refers to the fact that the level of A influences the effect of B, and vice versa.
Example:
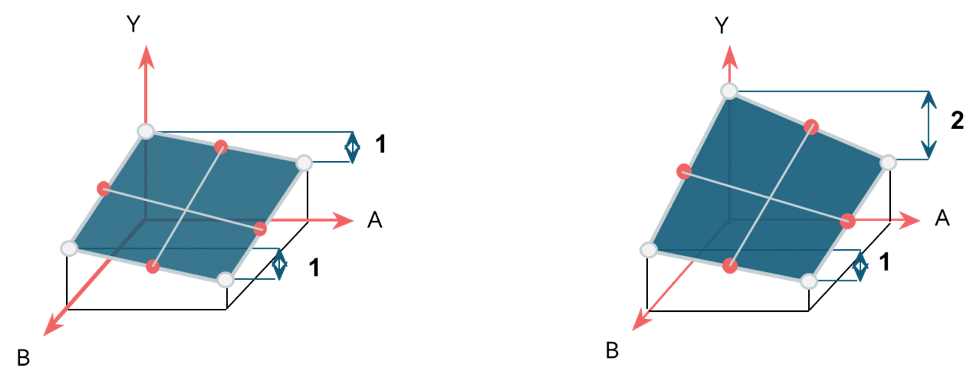
In the previous example, the figure on the left shows :
Whatever the level of factor B, the effect of A on Y is the same, and A has an effect of 1 on the response. There is therefore no interaction between A and B.
The figure on the right shows :
When the level of factor B is at a minimum, the effect of A on the Y is 2. When the level of factor B is at a maximum, the effect of A on the Y is 1. The effect of A varies according to the level of B. There is therefore an interaction between A and B.
When there is an interaction, we model the effect of the interaction by a multiplicative term in the Y prediction equation, here A*B.
The form of the forecasting equation would be :
Y=\alpha_0+\alpha_1*A+\alpha_2*B+\alpha_3*A*B
The term α3 corresponds to the A*B interaction
Notion of alias
An alias between two factors means that the factors have the same level for all experiments in the experimental design.
For example, let's suppose we've carried out the following experimental design:
| A | B | Y |
|---|---|---|
| 1 | 1 | 5 |
| 1 | 1 | 5 |
| 2 | 2 | 10 |
| 2 | 2 | 10 |
Factors A and B vary at the same time, so it's not possible to differentiate factor A from factor B, or to say which of the two causes the Y to change from 5 to 10 when it goes from 1 to 2. We'll say that these two factors are aliases.
Obviously, when constructing an experimental design, you choose your trials carefully so that no factor is aliased to another factor. However, it is possible for a factor to be aliased with an interaction. Take the following example:
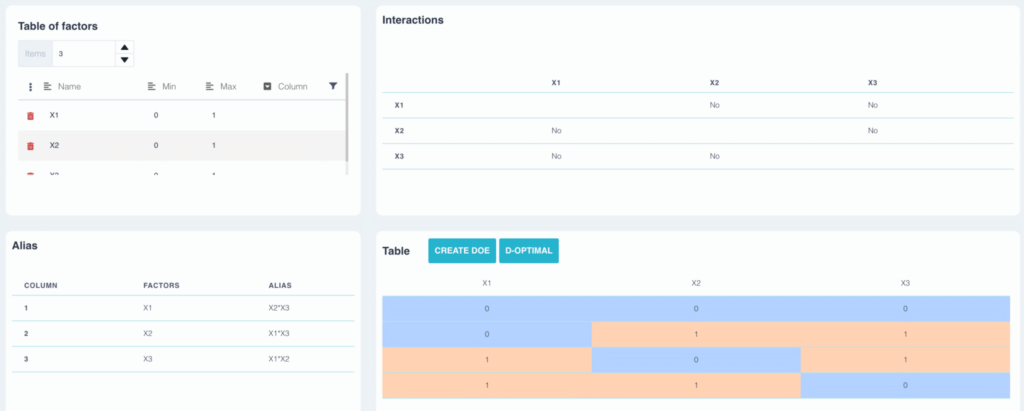
In this example, we've built a three-factor plan using table L4. The alias table shows :
- Factor a is aliased with interaction b*c
- Factor b is aliased with interaction a*c
- Factor c is aliased with interaction a*b
In the same way, if two factors are aliased, it will not be possible to say at the end of the experimental design whether the effect observed is due to factor a, to interaction bc or the sum of the two. We therefore assume that the interaction bc is zero, but this remains to be verified experimentally.
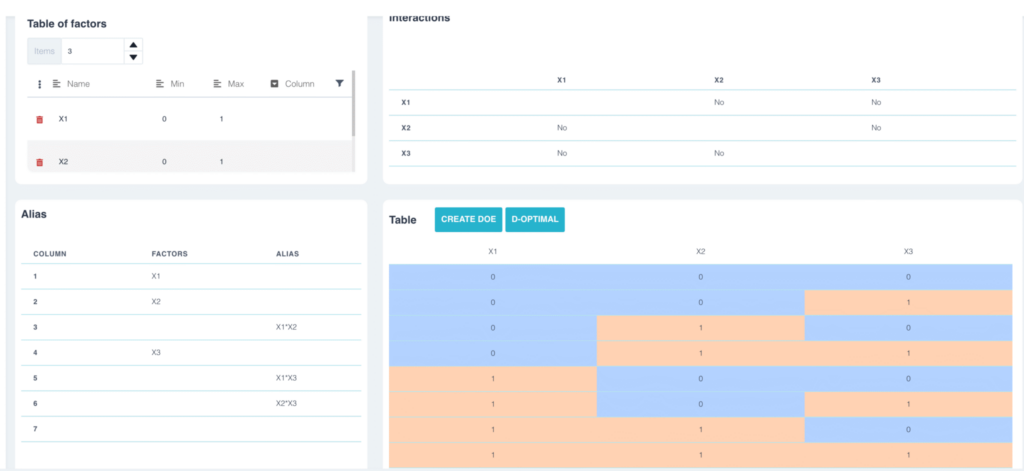
To avoid this type of problem, we generally choose experimental designs in which none of the factors are aliased with an interaction. In the previous example, we could have chosen an L8 design in which none of the factors is aliased with an interaction.
Solving a design of experiment
The resolution of an experimental design corresponds to its alias level.
Resolution III
An experimental design is of resolution III if at least one factor (order I) is aliased with a type A*B interaction (order II).
This type of design greatly reduces the number of trials, but assumes that all interactions are zero. Care must be taken when interpreting the results, and the hypothesis of zero interactions must be validated by additional trials.
Example:
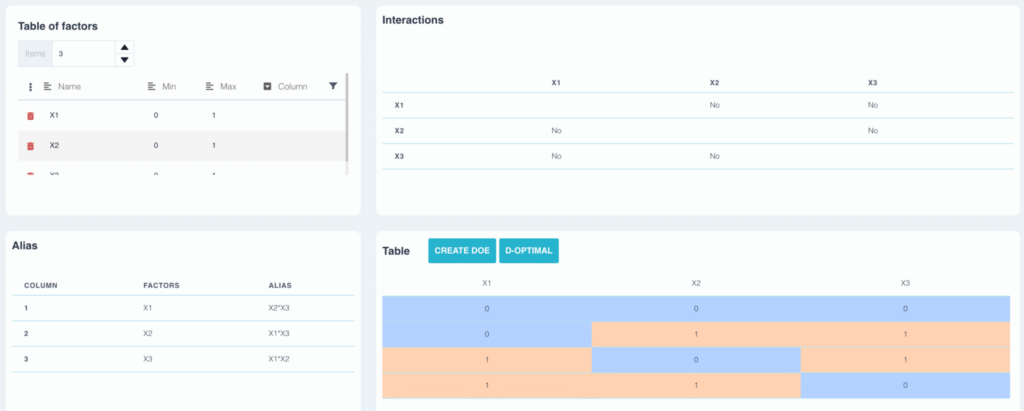
In the previous plan, factor a is aliased with interaction b*c. The plane is resolution III
Resolution IV
An experimental design is of resolution IV if :
- No factor is aliased with an interaction (order II)
- At least one interaction (order II) is aliased with another interaction (order II)
This type of design limits the number of trials. It assumes that the majority of interactions are zero, except for a few that can be identified. This is generally the case.
As the factors are not aliased with other interactions, we can unambiguously calculate the effect of all the factors.
This is the type of plan most often used.
Example:
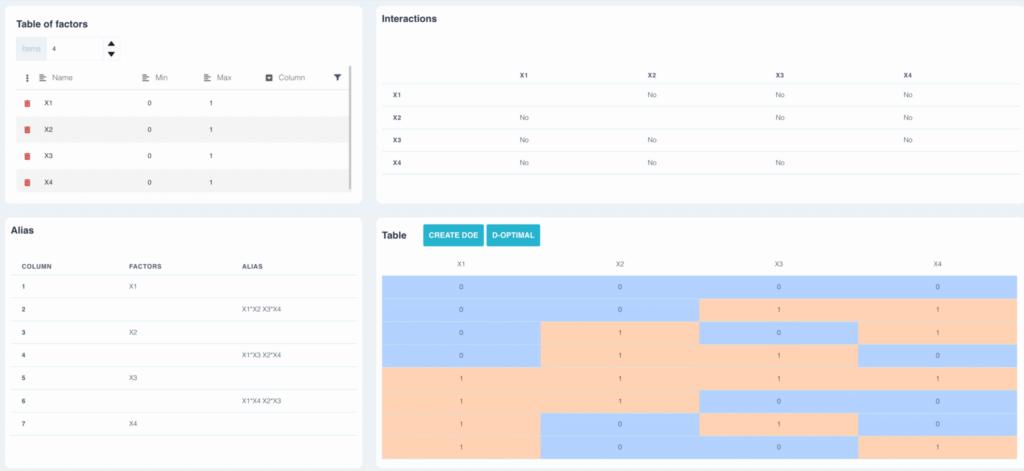
In the previous plan, none of the factors is aliased with another interaction. The interactions ab and cd are aliased, so the plan is resolution IV.
Resolution V
An experimental design is of resolution IV if :
- No factor is aliased with an interaction (order II)
- No interaction (order II) is aliased with another interaction (order II) This type of design limits the number of trials compared with the complete design.
As the factors are not aliased with other interactions, we can unambiguously calculate the effect of all the factors.
Since interactions are not aliased with other interactions, the effect of all interactions can be calculated unambiguously.
This is the ideal type of plan, but unfortunately there's only one with fewer than 20 trials. It's a 5-factor plan using the L16 table.
The Limitations of the Taguchi Method
The Taguchi method has been criticized by statisticians, and it is helpful to be aware of these criticisms in order to apply the method properly:
- The S/N ratio combines average and dispersion. It may mask patterns that a separate analysis of the mean and standard deviation would reveal.
- Interactions are often assumed to be negligible. With low-resolution tables, high interaction can skew the conclusions.
- Cross-matrices are costly to test. An L8 crossed with an L4 already accounts for 32 trials.
These limitations in no way diminish the value of the method. They simply serve as a reminder to verify the results and choose a resolution appropriate for the process. Today, other approaches round out the toolkit: response surface designs, D-optimal designs, or Bayesian optimization when each test is expensive.
Create Your Taguchi Designs with Ellistat
The module Data Analysis by Ellistat includes a proprietary design-of-experiments engine:
- You define the factors and interactions to be studied;
- The software suggests the most suitable layout from among the predefined tables (L4, L8, L12, L16, L20, L32) or from among the other available layout types;
- The analysis of results (effects, ANOVA, predictive model, multiobjective optimization) is performed within the same tool, without the need to use a spreadsheet.
Conclusion
Visit Taguchi method remains one of the most effective ways to structure industrial trials. Its orthogonal arrays reduce the number of experiments, its linear graphs simplify the design of experimental plans, and its philosophy of robustness changes the way a process is controlled: the goal is no longer simply to stay within tolerance, but to remain on target regardless of any disturbances.
When properly applied—with interactions selected based on an understanding of the process and systematic validation testing—it enables a reliable and long-lasting setup to be achieved in just a few dozen trials.
FAQ
What is the difference between a Taguchi design and a traditional factorial design?
Taguchi tables are standardized fractional factorial designs. The main difference lies in the approach: Taguchi provides ready-to-use tables and linear graphs, and emphasizes robustness through the signal-to-noise ratio. A full factorial design tests all combinations, which quickly becomes costly when there are more than four or five factors.
How many trials are needed for a Taguchi design?
It depends on the number of factors, their levels, and the interactions to be studied. An L8 design allows you to study up to seven factors at two levels in eight trials. If you want to estimate interactions unambiguously, you need a larger design, such as an L16.
What does the «L» in L8 or L16 stand for?
It comes from «Latin square» and refers to an orthogonal table. The number that follows indicates the number of trials in the design.
What is the Taguchi signal-to-noise ratio?
This is a metric, expressed in decibels, that combines the average and the dispersion of the response. The higher it is, the more stable the result is in the face of noise factors. Its formula depends on the objective: nominal, the smallest possible, or the largest possible.
Is the Taguchi method still used today?
Yes, particularly for factor screening and robust design in mechanical engineering, plastics engineering, and electronics. It is often supplemented by response surface models or more recent optimization methods when the process involves strong interactions or nonlinearities.
💡 Are you planning a test campaign? Try the Data Analysis module for free and let the design engine choose the Taguchi table that best suits your factors and interactions. To learn more about the method, the “Design of Experiments” training course guides you from defining factors to interpreting results.