Data Analysis Software
Complete List of Features
Ellistat Data Analysis is the statistical analysis module of the Ellistat suite: a web-based software application that automatically selects the appropriate test, verifies its validity conditions, and guides interpretation—all without requiring prior statistical expertise. It offers an alternative to Minitab, JMP, or Statistica for analyzing quality and process data.
Discover Data AnalysisKey Points at a Glance
Ellistat Data Analysis is the statistical analysis module of the Ellistat suite (which also includes APC [automatic machine tool tuning], SPC, IQC [incoming quality control], METRO, TRACE, OEE/TRS, and ROUTINES). It is a web-based industrial statistical analysis software program designed to provide the correct conclusion in just two clicks, without requiring statistical expertise: it automatically selects the appropriate tests, verifies their validity conditions, and guides the interpretation. It serves as an alternative to Minitab, JMP, or Statistica for analyzing quality and process data.
Test under real conditions
For us, the best way to prove that Ellistat is simple, ergonomic and complete is to let you test it for free for 1 month with your data and with your colleagues!
Complete Feature Chart
Designed to meet specific industry needs
Badge Web-only : Feature available only in the web version (not available in the desktop version)
| Field | Feature | Equivalent Terms (FR / EN) | Methods, Laws, Standards, and Details |
|---|---|---|---|
| Data management | Multi-user Shared Projects Web-only | Collaboration, project sharing | Private or public sharing, web application |
| Multiple Data Tables per Project | Data sheets, worksheets, data grids | Built-in spreadsheet: data entry, copy-and-paste like in Excel, fill handle | |
| Import from Excel and CSV | Data import, spreadsheet import | Multi-sheet, CSV transposition option | |
| Importing Zeiss Directories | MMT Import, CMM Data Import | Importing a complete set of .txt files from a coordinate measuring machine | |
| Importing Ellistat Desktop Projects | Migration, .eli2 | Data Import, Columns, and Gage R&R Studies | |
| Direct export from the SPC / IQC modules Web-only | Quality MES Integration, Closed-Loop Data | Right-click on any SPC chart or control → «Export to Data Analysis» | |
| Data Cleaning | Data cleaning, data wrangling | Right-click menu: duplicates, missing values, formats, column generation and calculation | |
| Classification and Tolerances by Characteristic | Column metadata | Nominal value, tolerances, control limits, target, distribution law, short-term indicator | |
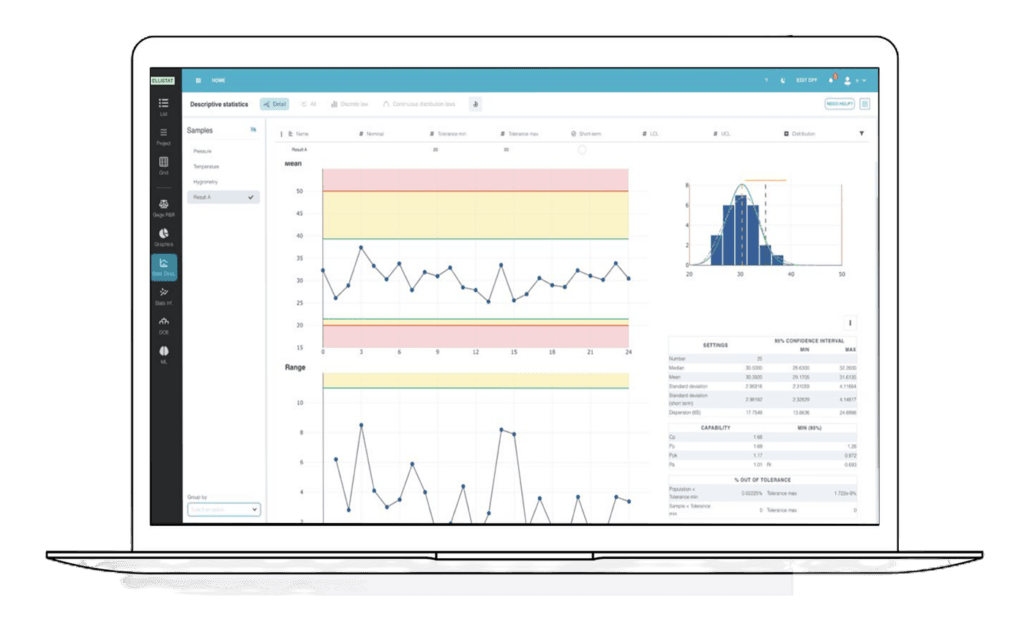
| Descriptive Statistics & Capability | Analysis of a Characteristic | Descriptive statistics, process capability report | Summary, histogram, Henry's line, timeline, detection rules |
| Short-Term and Overall Capabilities | Process Capability, Cp, Cpk, Pp, Ppk | Distinction between short-term and overall dispersion; centering on the mean or the target | |
| Fitting Distribution Laws | Distribution fitting, identification of a distribution | Continuous and discrete laws, suitability tests, values outside the tolerance range | |
| Attribute Control Charts | Attribute control charts | P, NP, C, U, and Laney P′ / U′ (overdispersion) | |
| Fourier decomposition | Spectral analysis | Detection of Periodic Patterns in a Production Signal | |
| Tolerance range | Confidence interval, tolerance interval, 95/95 | ISO 16269-6:2014, parametric and nonparametric cases, one-tailed and two-tailed, S-method or sigma method, multiple samples | |
| Prediction interval | Prediction interval | ISO 16269-8:2004, a finite-size, uniform, and bilateral future population | |
| Control Chart Limits Calculator | Control chart design, efficiency curve | Determining the Size of a Board Before Assembly | |
| Sampling Plan Calculators | Acceptance sampling, acceptance inspection plans | Attributes and measurements, ISO 2859 / ISO 3951 standards | |
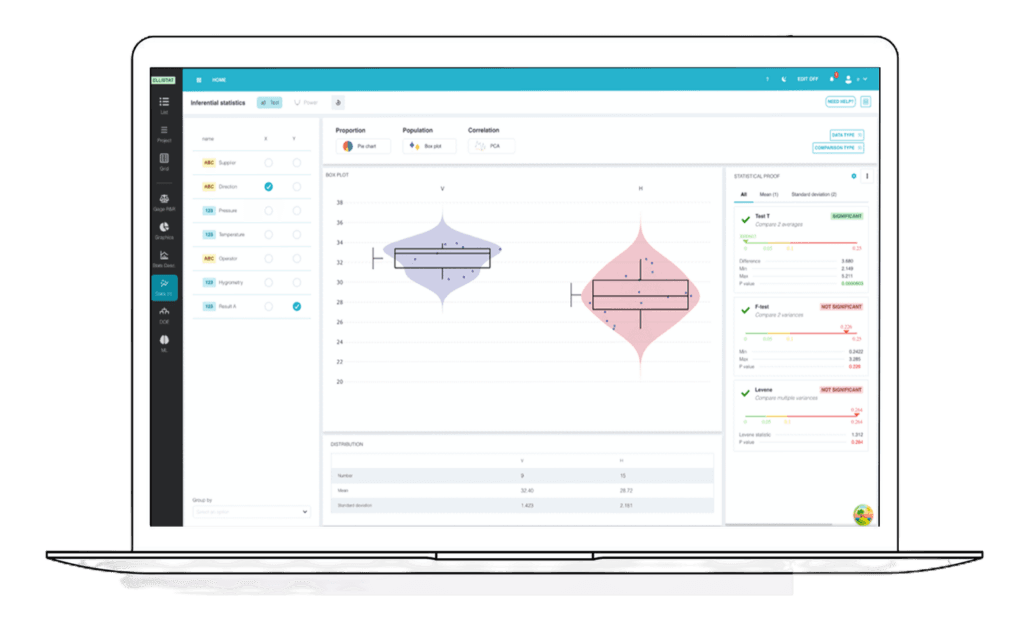
| Hypothesis Testing | Automatic Test Selection Web-only | Statistical Assistant, Automated Test Selection | Customized tests proposed and calculated from the outset: position, scale, and spread all on one screen; validity conditions checked automatically |
| Comparison of Positions | Comparison of Means, t-Test, ANOVA | Theoretical z and t, z-test, t-test, paired t-test, ANOVA, paired ANOVA | |
| Comparison of Scales | Comparison of variances, equality of variances | Chi-square, F-test, Fligner-Killeen, Bartlett, Levene, MAD permutation | |
| Comparison of Distributions Web-only | Goodness of fit between samples | Cramér-von Mises, energy test | |
| Rank Tests (Nonparametric) | Nonparametric tests | Signs, Wilcoxon, Mann-Whitney, B to C, Kruskal-Wallis, Paired Friedman | |
| Frequency Tests | Comparison of Proportions, Proportion Tests | 1P, 2P, Chi² | |
| Decomposition of the variance of a quantitative Y versus several qualitative Xs Web-only | ANOVA - Multivariate | Multivariate and Anavar parametric and nonparametric cross-tabulation, decision matrix, Pareto analysis of effects | |
| Multiple Comparisons | Post-hoc, pairwise comparisons | Pairwise comparisons following ANOVA or the Kruskal-Wallis test | |
| Tests on Summary Statistics | Summary Statistics Tests | Without raw data: given n, mean, standard deviation | |
| Power and Sample Size | Power analysis, sample size calculation | Effect expressible in units, average %, sigma multiples, or % of the tolerance interval | |
| Dichotomous search | Variable search (Shainin), sequential bifurcation, BOB/WOW variable search | Up to 8 suspected factors: BOB/WOW reference tests, sequential branching, ±2σ half-band (σ derived from the gap = 6σ or entered), handling of indecisive tests, complete 2² factorial confirmation design on the surviving factors, analysis of effects and ANOVA, diagnosis, transfer to a grid | |
| Shainin Tools | Shainin Problem Solving | BOB vs. WOW, component swapping, multi-vari | |
| Hierarchical decomposition of the variance of a quantitative Y versus multiple qualitative Xs Web-only | Nested ANOVA | Multivariate and Anavar: parametric and non-parametric analysis, automatic identification of hierarchical structure, decision matrix, Pareto analysis of effects, and analysis of the influence on the PPK | |
| Equivalence Testing | Equivalence of Means Web-only | TOST, two one-sided tests, equivalence testing | For a single target or between two samples, whether paired or independent |
| Equivalence of variances Web-only | Scale equivalence, variance ratio | Zone of indifference [1/R; R], logarithmic scale | |
| Equivalence of Proportions Web-only | Non-inferiority of proportions | Wilson score (target), Farrington-Manning (2 samples) | |
| Non-inferiority and non-superiority Web-only | Non-inferiority and non-superiority testing | Three selectable alternative hypotheses; a «difference × equivalence» decision matrix with an “undecided” case» | |
| Design Assistance Web-only | Sample size for equivalence | Smallest δ that can be demonstrated with the current sample size; sample size required for a given δ; δ in % within the tolerance interval | |
| Multivariate Statistics | Principal Component Analysis | ACP, PCA, principal component analysis | Correlation Circle, Pareto Chart of Eigenvalues, Illustrative Additional Variables, Labels |
| Multiple correspondence analysis | ACM, MCA | Qualitative variables | |
| Factor Analysis of Mixed Data Web-only | FAMD, factor analysis of mixed data | Quantitative and Qualitative Variables Combined | |
| Hotelling's T² statistic | Hotelling T-squared, multivariate test | Multivariate Detection of Atypical Points | |
| Unsupervised classification | Clustering, K-means, segmentation | Choice of K, reproducibility, 2D/3D PCA projections, variable-based discrimination tests (Fisher, Kruskal-Wallis) | |
| Hierarchical Classification | Dendrogram, hierarchical clustering | On individuals or on variables | |
| Experimental Designs | Flight Comparison Tool | DOE Assistant, Design Selection | For a given factors/interactions configuration, a list of possible designs ranked by quality (stars) |
| Taguchi 2-Level Factorial Designs | Fractional factorial designs, Taguchi tables | L4 through L32, interaction table, alias table, III/IV/V resolutions | |
| Multilevel Plans | Mixed-level designs, general full factorial | Whole or fractional: L4, L8, L9, L12, L16, L18, L25, L27… | |
| Screening Plans | Screening Designs | L12, L20, Definitive Screening Design (DSD3 through DSD12) — up to 19 factors in 20 trials | |
| Response Areas | RSM, response surface methodology | Center-weighted (α setting), hybrid, center-weighted | |
| D-Optimal Plans | D-optimal designs, custom plans | Constrained construction, correlation matrix of terms | |
| Mixing Plans | Mixture designs, formulation plans | Components totaling 100 % | |
| Filling Diagrams Web-only | Space-filling designs, Latin hypercube, Latin hypercube | Audze-Eglais criteria (overall coverage) and MaxPro (quality of projections in lower dimensions, suitable for screening), optimization via simulated annealing, Latin hypercube property | |
| Smart-Design Plans Web-only | OMARS Plan | Highly reduced systems that allow for factors completely independent of second-order terms | |
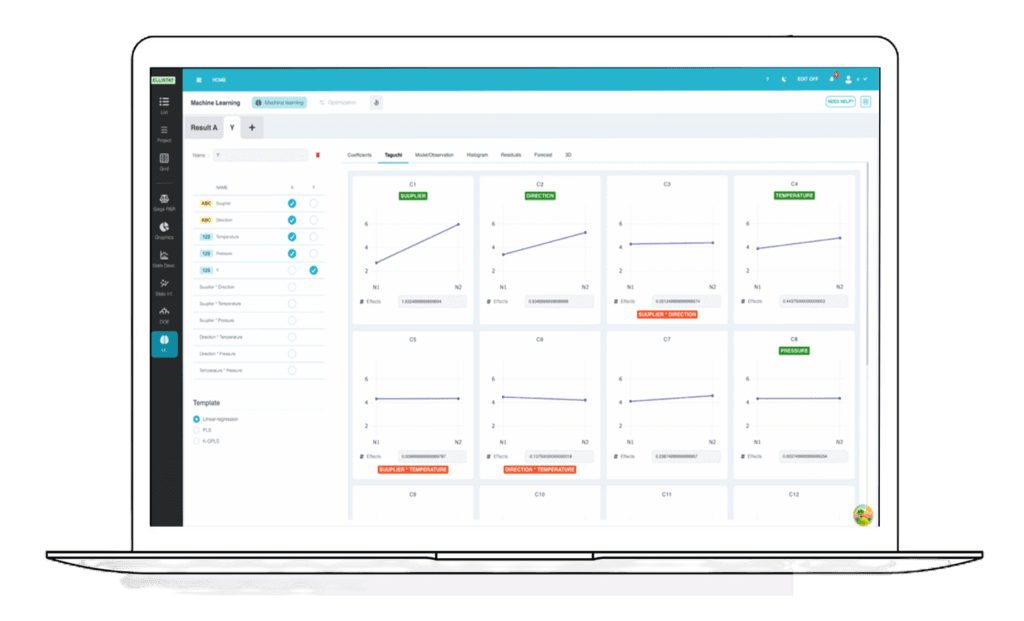
| Analysis of Plans | DOE analysis, effects plot | Automatic recognition of Taguchi designs, effect and interaction graphs, and multilevel analysis | |
| Machine Learning | Multiple Linear Regression | Multiple linear regression, GLM | Coefficients, p-values, R², VIF, quadratic terms and interactions, forward/backward stepwise selection, best subset |
| Binary and Multinomial Logistic Regression | Logistic regression, classification | Odds ratios with 95% CI (%), pseudo-R² (McFadden, Cox & Snell, Nagelkerke), global likelihood ratio tests, automatic switch to multinomial model | |
| PLS Regression | Partial Least Squares | Selection of the number of components based on R², coefficients with VIF | |
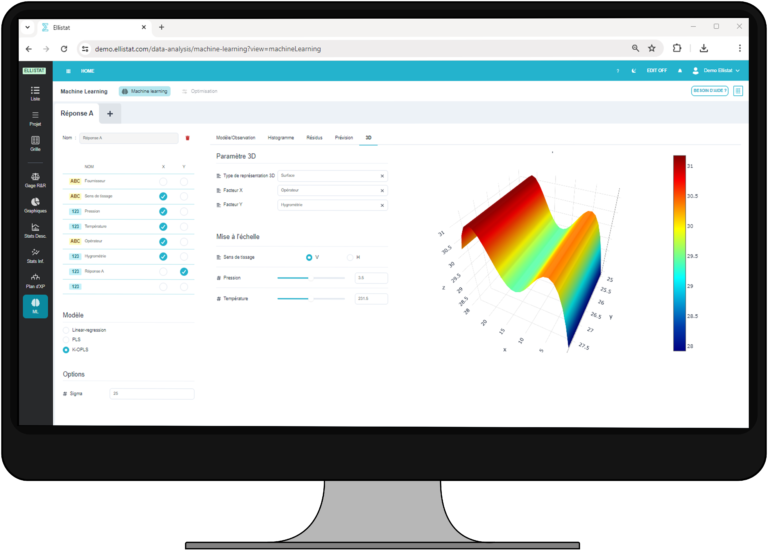
| K-OPLS Regression Web-only | OPLS Kernel, Kernel Regression | Gaussian RBF kernel, predictive and orthogonal components, automatic search for the best kernel and configuration | |
| Gaussian process Web-only | Gaussian process regression, kriging | Prediction with a confidence interval at any point, suitable for small samples | |
| Neural network | Neural network, MLP, deep learning | Multilayer perceptron: ReLU activation, configurable layers, learning rate with scheduler, mini-batches, L2 regularization, loss curve | |
| Decision Tree | Decision tree, CART | Gini index or entropy, depth, and minimum number of nodes; readable rules with impurity per node | |
| Random Forest Web-only | Random Forest | Bootstrap, feature importance | |
| SVM | Support Vector Machine | RBF kernel, C and gamma settings, maximum margin | |
| K closest neighbors | KNN, k-nearest neighbors | Classification by Similarity | |
| Model Validation Web-only | Train/test split, overlearning, overfitting control | Test lines, predicted/observed plot, confusion matrix, levers vs. residuals, normality of residuals, prediction with confidence intervals, 3D and 5D response surfaces | |
| Optimization | Multi-response optimization | Multi-response optimization, desirability | Desirability functions (target, maximize, minimize, bound), weights, global optimization, interactive sliders |
| Sequential Bayesian Optimization Web-only | Bayesian optimization, active learning, sequential DOE, alternative to the simplex method | Anisotropic Matérn 5/2 Gaussian Process (ARD), initial Audze-Eglais plan, conservative/balanced/exploratory strategies, process noise management, explained trial proposals with expected gain, convergence detection, leave-one-out diagnostics (Q², RMSE, MAE, 95% coverage %), factor sensitivity, demo mode | |
| Bayesian Optimization of Mixtures Web-only | Formulation optimization, mixture Bayesian optimization | Simple domain, maximin initial plan, ternary diagram with unfeasible regions, feasibility check of bounds, correction of invalid trials | |
| MSA — Analysis of Measurement Methods | Gage Linearity | Bias study, Cg Cgk, instrument capability | Deviation from True Value, Cg and Cgk, Accuracy Plot |
| Custom R&R Gage | Repeatability and reproducibility, Gauge R&R study, MSA | Analysis of Variance (ANOVA), two reference groups (tolerance and process), charts by operator and by part | |
| R&R Analysis by Attribute | Attribute agreement analysis, visual inspection | Kappa between inspectors and the standard, overall agreement, effectiveness, error and false alarm rates, stricter/less strict bias | |
| Linearity | Linearity Gage | Measurement Range Bias | |
| Comparison of Two Measurement Methods Web-only | Comparison of Two Methods | Allows you to demonstrate the equivalence of two measurement methods | |
| Inertia | Inertial Approach | Combines accuracy and repeatability in a single indicator; minimal tolerance range controllable by the instrument | |
| Selection of the Standard | MSA Reference Standard | Configuring the Selected Calculation Model | |
| Reliability | Sizing of Demonstration Tests | Reliability Demonstration Test Design, Validation Plan | Test plan (0 failures), chi-square plan (cumulative hours), MTTF plan, time to k failures; calculation of the variable selected by «padlock» |
| Stress-Strain Analysis | Stress-Strength Interference | Theoretical laws (including the trapezoidal rule) or experimental data, failure rate by overlap | |
| Estimation of Life-Time Distributions | Weibull analysis, life data analysis, survival analysis | 2- and 3-parameter Weibull (δ parameter), maximum likelihood or regression, CI, Anderson-Darling, Weibull paper, failure rate (hazard), MTTF/MTBF | |
| Distribution Laws Web-only | Distributions | Weibull 2 and 3, Exponential 1 and 2, LogNormal, Gaussian | |
| Mixing and Competing Risks Web-only | Mixing and Competing Risks | Automatic detection of two modes: mixed and concurrent computation | |
| Kaplan-Meier | Nonparametric survival curve, survival analysis | With censoring; survival comparison between two populations (suppliers, versions) | |
| Censored data, 5 input formats | Censored data, field return data, warranty data | Values + censoring, periods + censoring, sale/return dates, sale date + downtime (km), Nevada triangle for service returns | |
| Tracking Warranty Returns Web-only | Warranty tracking, actual vs. expected after-sales service returns | Actual Returns vs. Expected Returns Based on Established Principles, Adjusted for the Guarantee Period | |
| Return Control Charts Web-only | Warranty control charts (exclusive) | Division of Nevada into zones: proportion of returns, change in β, reliability by zone; readings by diagonal (age), column (seasonality), row (batch); distinction between aging in stock and aging in service | |
| Accelerated Testing | Accelerated life testing (ALT), aging tests | Arrhenius (activation energy), Eyring, inverse-power law, Peck, Coffin-Manson, Basquin; two combined constraints; acceleration factor, log-log graph | |
| Graphics | Contextual Catalog | Data visualization | Only the charts relevant to the selection are displayed |
| Proportions | Camembert, Pareto chart | Camembert chart, bar chart, Pareto chart with cumulative values, table | |
| Populations | Box plot, violin plot | Box-and-whisker plot, violin plot, histogram, line chart, control chart, Better to Current, ogive, ROC curve | |
| Relationships | Scatter plot | XY cloud, marginal distribution, regression, multi-X, and multi-Y | |
| Multivariate Analysis with Integrated ANOVA | Multi-vari chart, multivari graph | Graphical decomposition of variability across variation families, with analysis of variance as the associated statistical evidence | |
| Attached statistical evidence | Graphs with statistical evidence | Each graphical comparison can display the associated statistical test (including paired tests) | |
| Tolerance | Specigraph Web-only | Prediction intervals, orthogonal / Deming regression | Predicting a tolerance Y based on a regression in X, and vice versa. Simple 1X model or more complex 2X model with second-order terms |
| Monte Carlo Web-only | Monte Carlo Simulation | Dispersion simulation based on an equation using a two-stage draft model: Type D of ISO 22514-2 | |
| Dimension Lines Web-only | Dimension Chains | Simultaneous optimization of multiple interdependent dimension chains. Variation of the Y-direction’s severity across the X-directions. Monte Carlo simulation using a two-level sampling model: Type D as defined in ISO 22514-2. |
Your Feedback
A complete, modular solution
for industry 4.0
6 integrated statistical modules


Pricing for the Data Analysis statistical software
- Demonstration15-day trial / 1 year for students0€
- SPC
- Statistical Analysis
- Experimental Design
- MSA
- Graphical Analysis
- Machine Learning
- StandardThe best in commitment-free data analysis95€
- SPC
- Statistical Analysis
- Experimental Design
- MSA
- Graphical Analysis
- Machine Learning
- Technical support
- Updates
- Unlimited number of users
- Tacit renewal subscription
- AnnualThe best in data analysis (2 months free)950€
- SPC
- Statistical Analysis
- Experimental Design
- MSA
- Graphical Analysis
- Machine Learning
- Technical support
- Updates
- Unlimited number of users
- Tacit renewal subscription
Read More
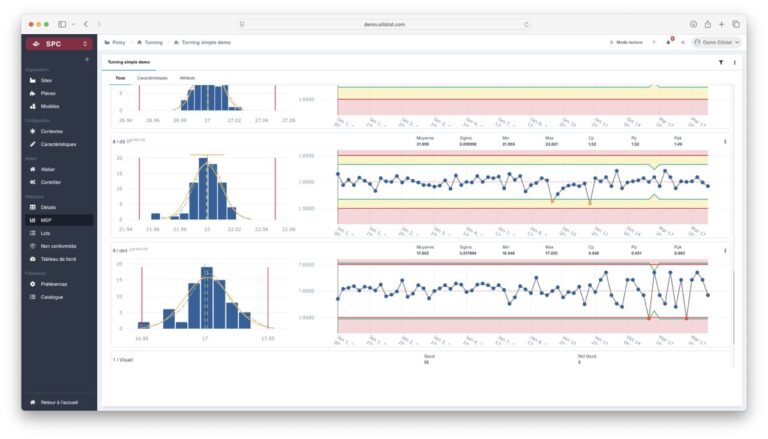
Xbar-R Control Chart: What Are the Red Lines For?
X̄-R Control Chart: What Are the Red Lines For? On an X̄-R control chart, the ...

At Ellistat, we don't calculate Cpk. And that's by design!
At Ellistat, we don't calculate Cpk. And that's by design! If you've ever opened a report...

Experimental Designs: Smart Design and Bayesian Optimization—What This Really Means for the Industry
For decades, the same thing has been repeated in industrial statistics courses: in experimental designs, ...
Which statistical software should you choose for the manufacturing industry?
Which statistical software should you choose for the manufacturing industry? Choosing statistical software that is suitable for the manufacturing industry is not an ...