Within a project, a key feature is the ability to create and use multiple grids. Each grid can be configured to contain a variety of information types. This means that each grid can be tailored to the project's specific data collection and presentation needs.
Composition of the Ellistat grid page
The grid page can be divided into 3 parts. The diagram below shows these 3 zones.
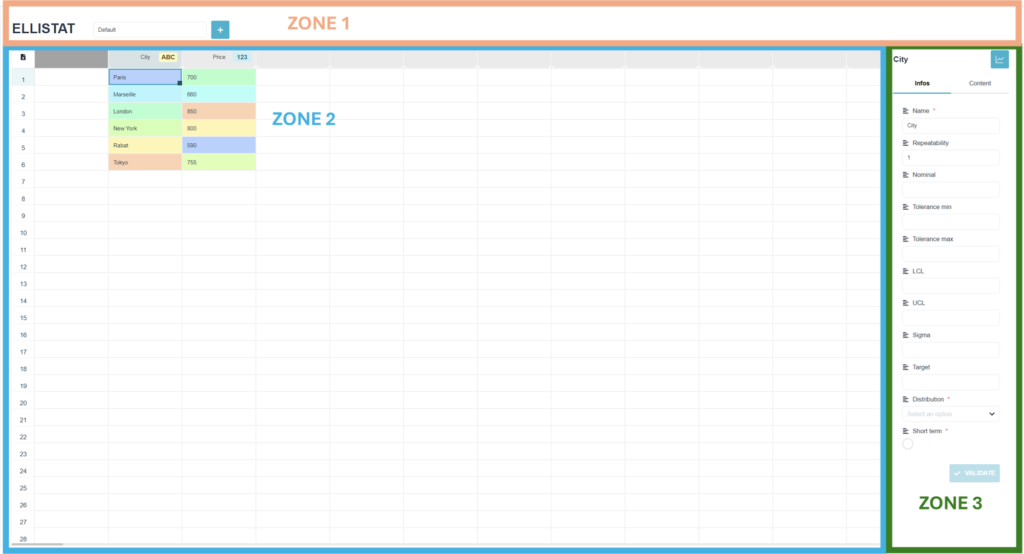
Zone 1 Contains the project name and the various project grids.
Zone 2 Contains grid data. Each data column contains a title and the data.
Zone 3 Contains additional information about the selected column. Such as name, customer specifications, data distribution, etc.
1. Creating a grid in Ellistat Data Analysis:
A grid can be configured to contain a variety of information types. All the grids in a project can be found in the drop-down list in zone 1.
The following video shows how to create a grid entitled "Monday".
Then we can create a second grid entitled "Tuesday".
2 Entering data in the grid
Ellistat offers a wide range of data import options to suit your specific needs. Data is entered in zone 2 of the grid page.
The video below shows data entry.
Ellistat software uses meaningful visual indicators such as :
⇒ The data type displayed on the right-hand side of the column heading.
⇒ A color code that displays high or low trends for quantitative data, or simply differentiates between the different modalities of a qualitative variable.
3.grid column settings
Column parameters are set in zone 3. During this step, you will enter additional information that will be used later to :
⇒ Draw certain graphs and perform descriptive statistical analyses.
⇒ Sort data using filters
3.1 Draw certain graphs and perform descriptive statistical analyses.
The video below shows how to set up lag data and obtain a descriptive statistics report.
- Name: Column name: this name will be used to recall the column in other pages of the application.
- RehearsalsNumber of columns belonging to the same sample. This makes it possible to group several columns into a single one. This can be used, for example, to add repetitions of a design of experiment or to add several consecutive measurements in the case of an SPC analysis.
- NominalNominal value of characteristic
- Min. tolerance: Relative value of min tolerance compared to nominal
- Max. tolerance: Relative value of max tolerance compared to nominal
- Lower monitoring limit: Absolute value of the monitoring limit that will appear on the control charts.
- Sigma: known value of sample standard deviation
- Targetsample target value
- Distributionknown distribution of the sample, by default the normal distribution will be used
- Short term: Indicates whether the samples were collected on a short-term basis (in which case Cp and Cpk will be calculated) or on a long-term basis (in which case Cp, Pp and Ppk will be calculated).
3.2. Sort data using filters.
The video below shows the sorting of offset data from machines A and B.