- August 11, 2026
- August 11, 2026Situation: Cause and Solution «No graph available» The selected combination of variables does not allow for any relevant graph. Review your selection: type…
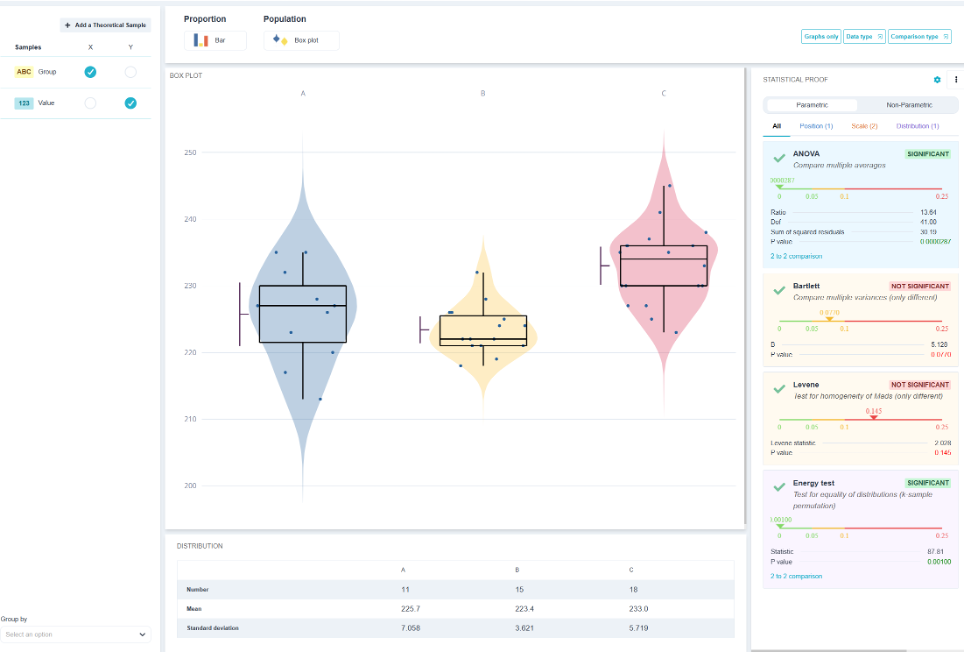
- August 11, 2026Your Question | Visualization | How are my measurements distributed? | Histogram | Are these two groups different? | Box-and-whisker plots + statistical evidence | Is my process stable? | Map…
- August 11, 2026With several quantitative Y variables, two representations emerge, both of which are multivariate: These two tools each have their own menu, plus…
- August 11, 2026💡 To create a predictive model of Y based on several X variables, select the Machine Learning menu. The Graphs menu describes the effect…
- August 11, 2026⚠️ Correlation does not imply causation. Two variables may vary together because a third variable controls them: ambient temperature causes a change in…
- August 11, 2026You can choose whether you want the X-axis to be independent for each histogram, the same for all histograms, or all histograms stacked. 💡 Histogram and…
- August 11, 2026For qualitative data, we count the number of instances. 💡 The Pareto principle is only useful if the categories are homogeneous in terms of severity. Sort…
- August 11, 2026FamilyRepresentationsWhen it appearsProportionPie chart, Bar chart, Pareto chart, TableQualitative dataPopulationBox-and-whisker plot, Histogram, Line graph, Control chart, Better-to-Current chart, Ogive chart, Curve…
 August 11, 2026A button toggles between two modes: ⚠️ This is the most important distinction in the menu. A graph suggests, a test concludes.…