


For qualitative data, we count the number of participants.
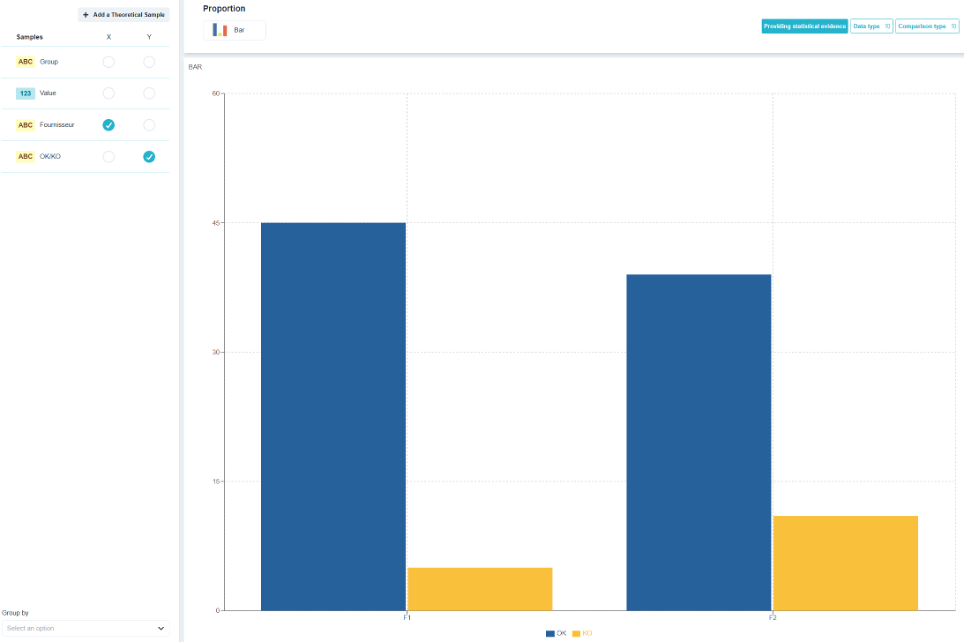
- Camembert : the proportion of each mode relative to the total. Readable up to five or six proportions; beyond that, the eye can no longer compare the angles.
- Bar : the same content, with a more detailed comparison. This is the preferred option when the shares are close.
- Pareto : the categories listed in descending order by headcount, including the total. This is the prioritization chart — it identifies the few causes that account for the majority of defects.
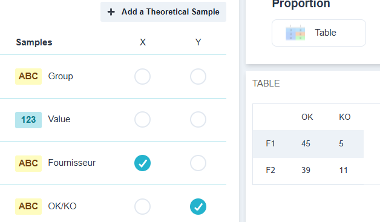
- Table : sample sizes and proportions expressed as numbers, along with their confidence intervals.
💡 The Pareto principle is only useful if the conditions are homogeneous in terms of gravity. Sorting defects—one of which costs 100 times more than the others—leads to addressing the most frequent one instead of the most expensive one. In this case, apply weighting first.