


Six approaches, ranging from the most hands-on to the most automated.
1. Typing and Copy-and-Paste
The grid works like a spreadsheet: direct entry, copy-and-paste a block of cells from Excel, and a fill handle to copy a value or a series.
2. Excel
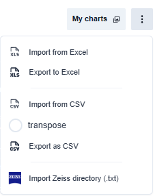
The ⋮ menu in the upper-right corner of the grid → « Import from Excel ». Ellistat reads the workbook, announces the number of sheets found, and then lets you Import all the sheets or just the ones you choose. Each imported sheet becomes a grid in the project.
3. CSV
" Import from CSV », with a box labeled « transpose » in the menu for files where the variables are in rows rather than columns.
4. A Zeiss catalog
" Import a Zeiss directory (.txt) »Reads a complete folder of coordinate measuring machine measurement files, sorted by name. This is the production import: one folder, one grid.".
5. An .eli2 file
From the Projects page, «Import an .eli2 file» imports a project Ellistat Desktop : The file is converted into a web project, along with its data, columns, and Gage R&R studies.
6. From another Ellistat module
This is the least well-known—and often the most useful—method. On most of the app's screens: SPC, IQC, METRO… right-clicking on a column header brings up « Export to Data Analysis ». The window lets you choose:
- Create a new project, along with its name; ;
- or Add to an existing project, by selecting the project and the name of the new grid; ;
- and Open in a new tab, to keep the original page in view.
💡 This approach changes the way we work. Instead of exporting to Excel and then reimporting, you can send a part’s SPC measurements—or inspection results—directly into an analysis project without having to re-enter data, without using an intermediate file, and without the risk of transcription errors.
⚠️ An Excel or CSV import creates grids ; it does not add rows to the current grid. To add rows to an existing grid, you need to use copy and paste.