


The button D-Optimal, which appears on the Taguchi, XN, Sweep, and Response Surface pages, opens a separate module. The principle is to start with a set of’candidate tests and extract the subset that maximizes the decisive of the information matrix—in other words, the one that provides the most information for the target model.
⚠️ Important but easily overlooked point: On the Taguchi, XN, and Scan pages, the candidate runs are not those in the displayed fractional table but those from the complete plan. This makes sense because we're looking for the best possible subset—not the best subset of a subset—but it does change what you see in the Candidates tab.
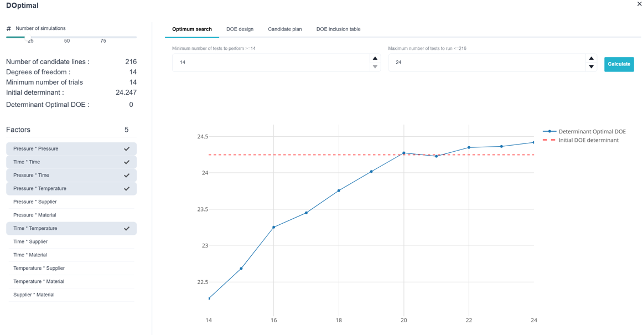
1. The panel on the left
- Number of simulations : the number of random searches per plan size, ranging from 10 to 100 (default is 25). The higher this number is, the closer the solution is to the optimum, and the longer the calculation takes; ;
- Number of candidate lines, Degrees of freedom, Minimum number of attempts : the problem constraints. The minimum number of trials is equal to the model's degrees of freedom, minus the number of trials you specify; ;
- Initial determinant and Doptimal Determinant : the reference value and the result. The result is color-coded: green if it is above 99 % of the reference value, orange if it is between 95 and 99 %, and red if it is below that; ;
- Factors : the choice of terms in the model. This is where we add the interactions to be estimated, which increases the degrees of freedom and thus the minimum number of trials.
2. The four tabs
Search for the Optimum : You specify a minimum and maximum number of trials, and Ellistat plots the resulting determinant as a function of the number of trials, with the determinant of the initial plan shown as a red dotted line. The calculation can be undone.
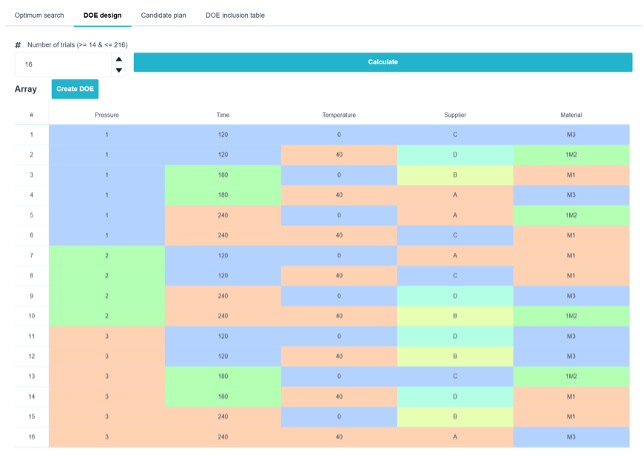
Creating the Plan : We specify the number of trials and obtain the corresponding D-optimal design, which can be converted to a grid format just like the others.
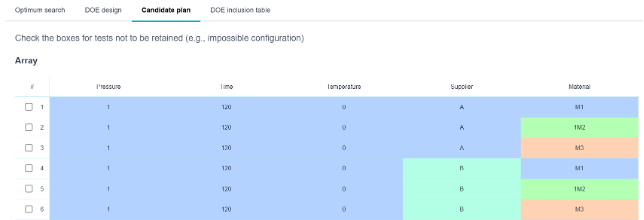
Candidate Essays : the list of candidates, with a checkbox per line: «Check the boxes for tests to be excluded (e.g., impossible configuration).» This is where you remove the unfeasible combinations.

DOE Inclusion Table : the tests you want impose in terms of layout, regardless of what the optimization feature says. You set the number of rows, enter the values, multi-cell copy-and-paste from a spreadsheet works, and «Clear Table» resets everything to zero. A cell with a background color red indicates a condition that does not exist in the candidates.
💡 It is the combination of these last two tabs that makes this module so valuable, and it has no equivalent in the standard tables: Remove the impossible tests and require the tests that have already been conducted. It also addresses the need to «supplement an existing plan»—the tests that have already been performed are specified, and the optimization process selects the next ones.
⚠️ The result depends entirely on the quality of the set of candidates and the specified model. A D-optimal design for a model without interactions is not D-optimal for the same model with interactions: the module optimizes exactly for what is asked of it.