


All other pages on Data Analysis are subjected to Data: It describes, compares, and models what production has chosen to produce. The design of experiments does the opposite; it causes the data. We decide in advance which settings to test, in what order, and how many times, so that each test provides information that no other test does.
This is what makes all the difference: in observational data, two factors that always vary together are inseparable, and no statistical method can separate them. In a design of experiments, we vary them by design, this is orthogonality, and we obtain effects that can be estimated separately, and thus causality.
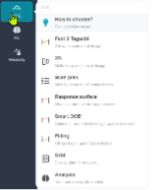
This menu answers three questions:
- What factors really matter? : screen a large number of factors with few trials; ;
- How do they go together? : modeling interactions and curvature; ;
- What is the optimal setting? : Adjust a response surface and analyze it.
Click on the «Data Analysis» menu, then click on «DOE.».
⚠️ A design of experiments always belongs to a project. If no project has been selected, the page prompts you to choose one. Each plan type has its own set of plans, displayed as tabs at the top of the page, with a «+» icon to create a new one. The plan name can be edited, and it will be the name used for the data grid created from that plan.
Ellistat provides a very comprehensive catalog of the various possible experimental designs, including the latest publications in this field, such as Smart DOE.