1. The Specifications Table
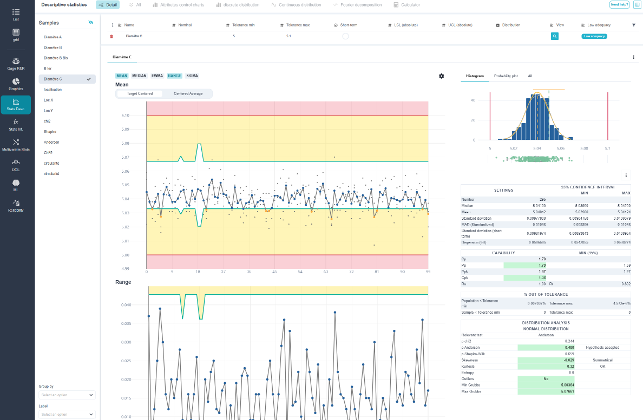
At the top of the screen, a table summarizes the definitions of each characteristic. The main columns are:
- name : the variable's name; ;
- sigma and short term : the two distributions; ;
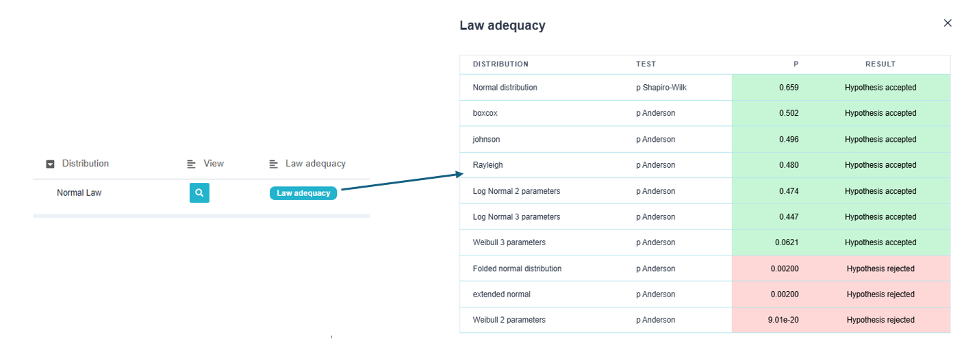
- distribution and legal compliance : the adjusted law and the quality of that adjustment; ;
- min/max tolerance, LCI and LCS : specification and control limits; ;
- target and nominal : the target value.
💡 The column Compliance with the law is the first thing to check. All capability indices assume a specific distribution; if the fit is poor, the displayed Cp and Cpk values are meaningless, and you must change the distribution or transform the data.
2. The Charts
- Histogram : the shape of the distribution, showing the fitted distribution superimposed on it and the tolerance limits. At a glance, one can see skewness, excessive dispersion, and bimodality—a common sign of a mixture of two populations, two machines, or two batches of material.
- Henry's Right : The data points align if the distribution follows the law. This is a more sensitive visual test than the histogram, especially at the tails of the distribution—precisely where nonconformities occur.
- Control Chart : chronology. It answers a question that the histogram does not address: Is the process stable ?
- Scope : the variation within each sample over time.
- EWMA : a weighted moving average, which is more responsive to small, sustained deviations than a traditional map.
⚠️ Histograms and control charts are not interchangeable. A process that is drifting slowly may produce a histogram that looks quite acceptable: the measurements from the beginning and the end blend together, and the overall distribution appears wide but centered. Only the control chart reveals the drift.
3. Centered on the average or centered on the target
The charts can be interpreted using either of two reference frames:
- Center-mid : The confidence intervals are constructed around the observed mean. We assess the stability : Does the process remain true to itself?
- Center-aligned : The limits are set around the target value. We evaluate the compliance : Does the process produce what is required?
💡 A process can be perfectly stable yet consistently off-target. When centered on the average, it appears to be under control; when centered on the target, the deviation becomes apparent. Look at both.
4. Detection Rules
Beyond simply exceeding the limit, Ellistat Data Analysis indicates unlikely configurations under the assumption of a stable process:
| Rule | What it detects |
| Trend | A series of points that rise or fall: tool wear, thermal drift. |
| Same side | A series of points on the same side of the mean: the process has moved to a new level. |
| Close to the Limits | Clusters of points near the boundaries: underestimated dispersion or population mixing. |
| Reciprocating motion | A systematic alternation: often two sources alternating, two setups, two operators. |
The Landmark Alert highlights the relevant points.
💡 These rules increase sensitivity to minor deviations, but each one adds the risk of a false alarm. In a process that’s already under control, activating too many of them will set off the alarm for no reason.
5. Capabilities
Four indicators, two distinctions to be aware of:
- Cp and Cpk use dispersion short term : the performance the process is capable of if it remains stable.
- Pp and Ppk use dispersion overall : the actual performance delivered, including deviations.
- Cp and Pp ignore centering; ; Cpk and Ppk take this into account.
When viewed together, the four are more meaningful than each one on its own:
| Finding | Interpretation |
| High Cp, low Cpk | A fairly accurate method, but off-center. Can be corrected by adjustment. |
| Cp ≈ Cpk, both of which are low | Method too scattered. Requires a fundamental technical fix. |
| High Cp, low Pp | A method that is capable but unstable : It's drifting. Look for the cause over time. |
| Cp ≈ Pp | Stable trend; the short term reflects the long term. |
💡 The «High Cp, Low Pp» scenario is the most common and the most frequently misinterpreted: technically, there’s nothing wrong—it’s the process control that’s slipping. A well-maintained control chart can resolve this without any investment.
6. Distribution Analysis
A very comprehensive distribution analysis is provided, including goodness-of-fit tests, skewness, kurtosis, and entropy parameters, as well as outlier detection. You can select the distribution; the "Goodness-of-Fit" button provides a summary of the goodness-of-fit tests.