


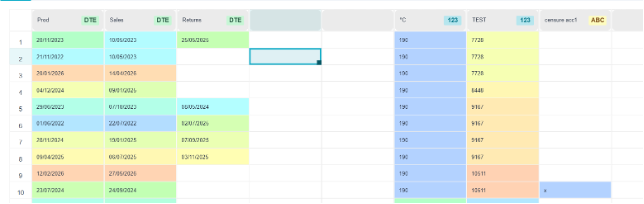
Each column has a data type—it can be a numeric, text, or date column—which can be changed by clicking on the icon. A column containing numbers may actually be a string column if, for example, it contains a product reference expressed as a number, such as 833256. It’s important to correctly classify the data because this determines the choice of appropriate charts and hypothesis tests.
Formatting data across multiple columns.
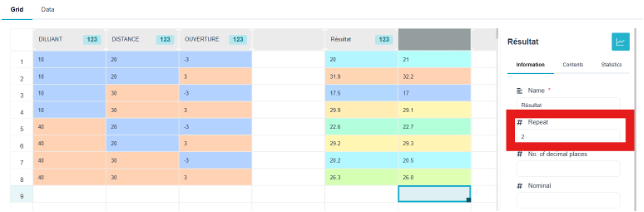
Sometimes, particularly when working with experimental designs or control charts, it’s easier to display the results in multiple columns. It’s very easy—you just need to specify the number of columns to use for the selected variable.
Conditional data formatting is automatic, which is a major advantage—and indeed essential—for detecting potential outliers or inconsistencies in the data.