


A button toggles between two modes:

- Graphics Only : visualization alone; ;
- Provide statistical evidence : Ellistat adds the test corresponding to the displayed comparison, along with its p-value and conclusion.
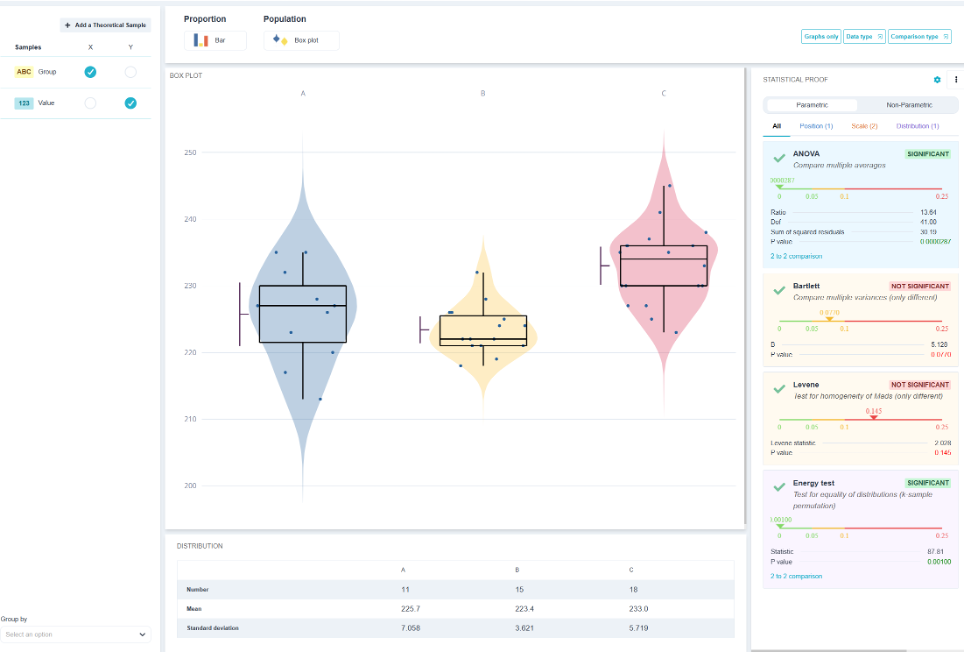
⚠️ This is the most important item on the menu. A graph suggests, a test concludes. Two outlier boxes for mustache counts could very well be due to chance if the sample sizes are small: without the test, we’re reporting a difference that doesn’t actually exist.
💡 During a meeting, show the graph and state the p-value. The former is persuasive; the latter provides a safety net.
But in this section, we'll focus only on the graphics