


This page searches for the frequency a signal: something that repeats at regular intervals but remains invisible on a control chart.
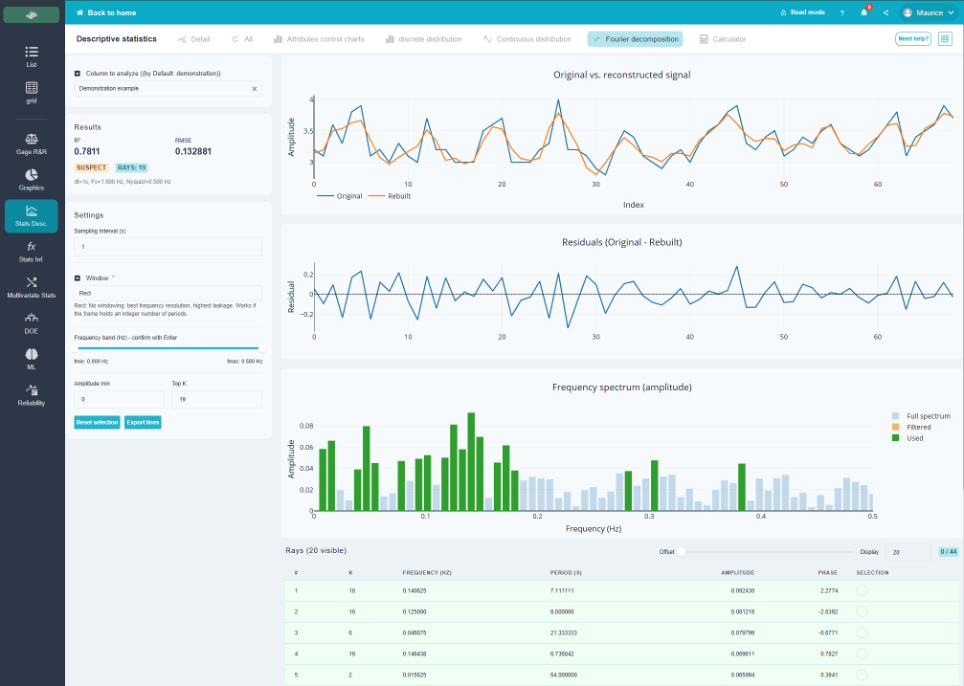
The settings:
- Sampling interval : the time interval between two measurements. This interval defines the frequency scale; without it, the results are expressed in arbitrary units; ;
- Window : windowing applied before processing, to minimize edge artifacts; ;
- Frequency band (Hz) : restricts the analysis to a range; ;
- Top K and Minimum amplitude : Keep only the strongest lines.
The results show the spectrum, the table of rays, frequency, and amplitude, the signal rebuilt superimposed on the original, and the residue. Stingrays are exported.
💡 A clear trend is physically defined by its period: a spindle rotation, a conveyor rotation, a thermal control cycle, or a shift change. It is the residual error that indicates whether the model has captured the essence; if it remains structured, a periodicity has been missed.