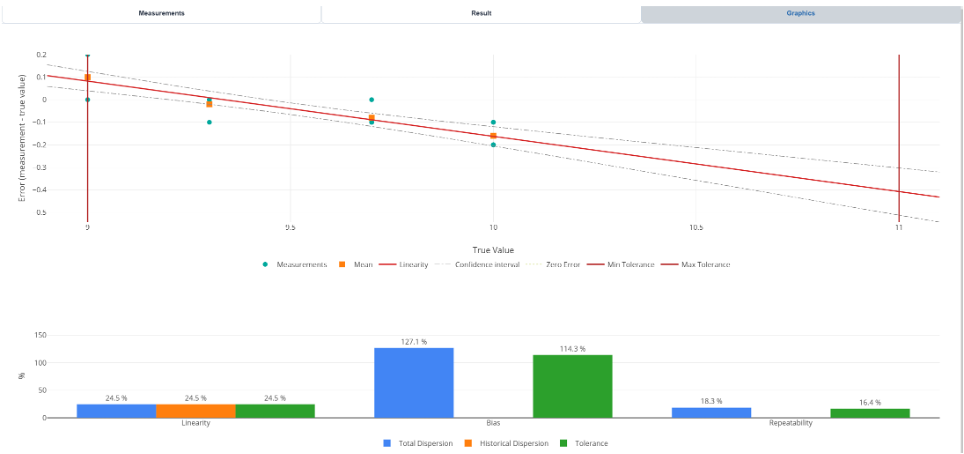
An instrument may be accurate right in the middle of its range but inaccurate at the extremes. The linearity test measures several products with different actual values, distributed across the entire operating range, and examines how the error changes.
Enter the number of products, the number of Values by Product, and for each product, its true value and its measurements.
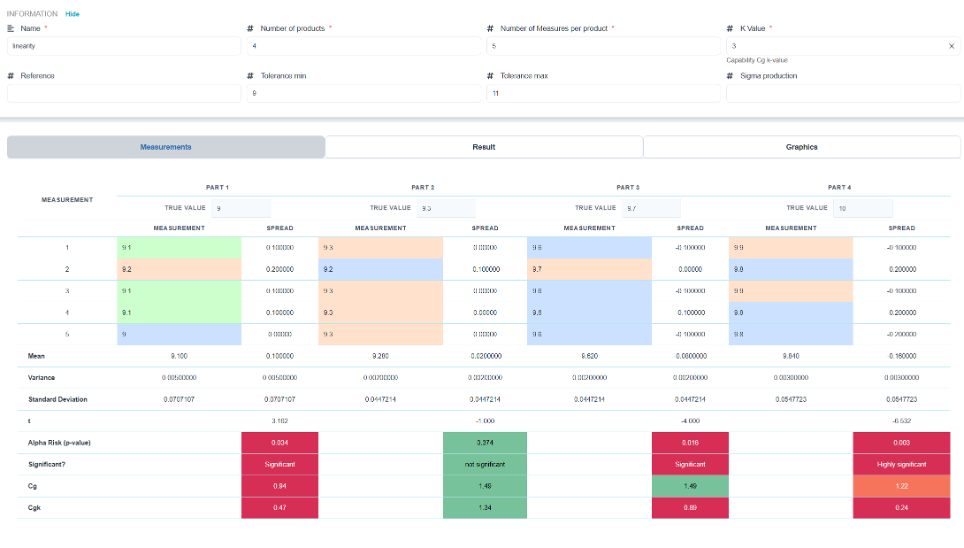
The results consist of two figures, each with its own significance:
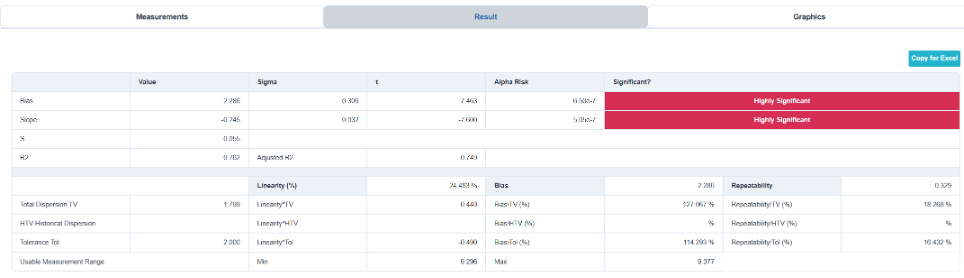
- The Slope : Does the error increase with the measured value? A significant slope indicates a lack of linearity—the instrument is accurate here but inaccurate there.
- Accuracy : the mean error, which is independent of the value. It is a constant offset that can be corrected through calibration.
Significance is determined according to the standard Ellistat scale:
| p-value | Conclusion |
| p > 0.1 | Not significant |
| 0.05 < p ≤ 0.1 | Significant limit |
| 0.01 < p ≤ 0.05 | Significant |
| p ≤ 0.01 | Very significant |
The percentage of linearity is also related to the tolerance and total variation.
💡 A negligible slope and significant accuracy represent the ideal scenario: simple calibration is sufficient. The opposite—a significant slope—requires limiting the range of use or switching to a different method.
A graph illustrates the previous results