


T² addresses a control issue: Is this part compliant, considering all its characteristics as a whole?A part may fall within the tolerance range for each dimension and still be nonconforming due to the combination of those dimensions—and that is precisely what dimension-by-dimension inspection fails to detect.
The T² measures the distance of each individual from the center of the cloud, taking into account the correlations between characteristics (Mahalanobis distance). The graph resembles a control chart: one value, one limit.
Zone 1 : Options.
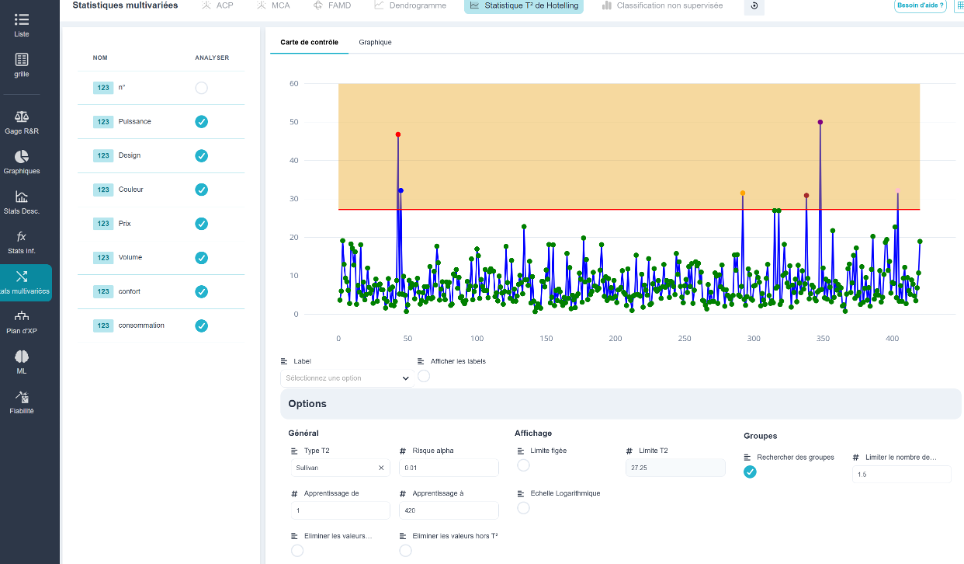
⇒ Learning about / from : the lines used to establish the reference (mean and covariance matrix). The others are compared to this reference; ;
⇒ Type T2 : the method used to calculate the limit—Sullivan, Classical, or Chi-squared; ;
⇒ alpha risk : the risk of a false alarm; ;
⇒ Fixed Limit : sets a limit rather than recalculating it; ;
⇒ Remove outliers and Remove outliers from T² : clean the training sample so that the reference is not based on outliers; ;
⇒ Search for groups : identifies outliers that are close to one another and colors them by group. Outliers that deviate in the same way indicate a common cause; ;
⇒ Logarithmic Scale : legible when one point stands out from all the others.
Zone 2 : the associated cloud.
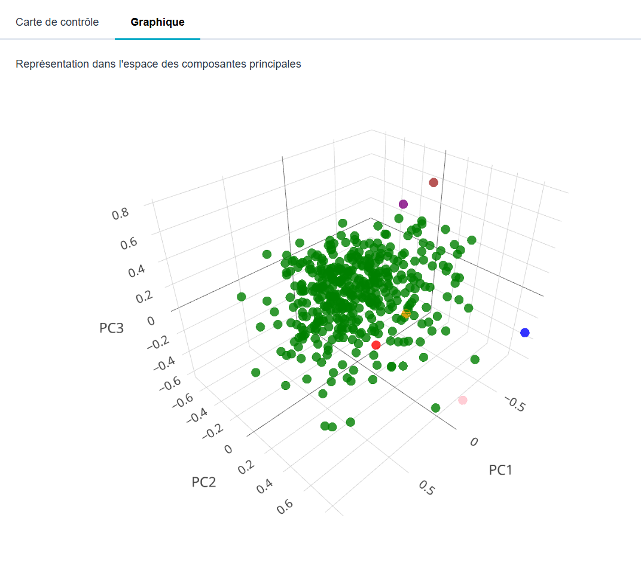
⇒ With 2 variables, it displays the individuals and the’confidence ellipse : the multivariate compliance boundary. This is the most illustrative representation; ;
⇒ With 3 variables, the three-dimensional cloud; ;
⇒ More than 3 variables, the individuals are plotted on the PCA factor plane, which is the only possible representation.
💡 A T² that is generated without any characteristics falling outside the tolerance limits is an interesting case: the combination has changed. Switch to PCA to see which link has changed.