


A chart generated on an analysis page is temporary: changing the selection replaces it. The library My graphics is used to keep the ones that matter.
1. Save
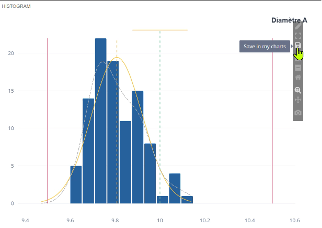
Each chart has a floating toolbar in the upper-right corner that appears when you hover over it. The icon for floppy disk «Save to My Charts» opens a form with two fields, Title and Comment. Upon validation, the graph is captured and attached to the project.
The same toolbar includes other commands depending on the page: open the graph in full screen, adjust its options, change its colors, switch to multiple Y-axes, and the usual Plotly commands—zoom, pan, and download as an image.
2. Find
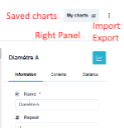
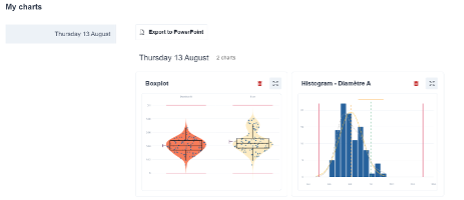
The button My graphics, at the top of the grid page, opens the project library. The charts are located there grouped by day, from newest to oldest, with date-based navigation on the left.
3. Export
The button Export to PowerPoint Puts the list into selection mode: you can check the charts one by one, by full day, or all at once, and Ellistat generates a presentation. The counter on the button shows how many charts will be included.
💡 This addresses a very specific need: the monthly review or presentation of an improvement project. You take notes as you analyze, without worrying about formatting, and then produce the final document at the end in the chronological order of your reasoning—which is precisely the order in which you want to present it.
⚠️ A saved chart is a image, not a live link to the data. Editing the grid afterward does not update it. This is an advantage—it reflects the state of the data at the time of the analysis—but you need to be aware of this before building a monthly tracking system based on saved charts.