


The previous plans all aim to estimate a given model — linear, with interactions, quadratic. Filling schemes have a different purpose: cover the experimental area evenly, without assuming the form of the answer.
This is the approach taken by machine learning models, which learn the shape rather than assuming it. The factors must be quantitative, you need some at least two and no more than 20.
1. Calculated chart or tabulated table
The list of possible layouts includes two categories:
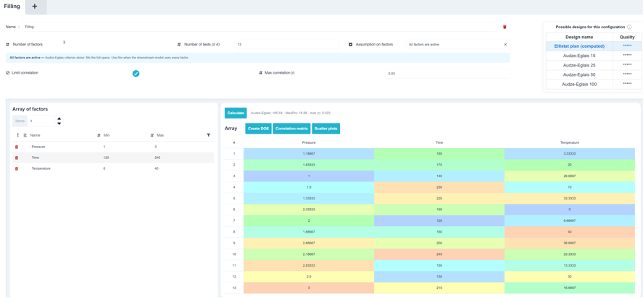
- Ellistat Map (calculated), the first option offered and selected by default: the only one whose number of attempts and criteria match your configuration; ;
- Visit tabulated tables, with a fixed number of trials: Audze-Eglais (9, 15, 16, 25, 50, 100 trials depending on the number of factors), Latin Hypercube Design (16, 25, 50), and NOLH 17. For more than 10 factors, none of these designs remain viable; only the calculated design is suitable.
2. Settings for the calculated plan
| Adjustment | Role |
| Number of factors | Reminder: read-only. |
| Number of trials | At a minimum k+1, up to 100. The default value is five trials per factor, with a minimum of 9. |
| Hypothesis on the factors | «All factors are active» or «Only a few factors are active.». |
| Limiting Correlation | Enforces maximum correlation between factors. Enabled by default. |
| Maximum correlation |r| | The target is 0.03 by default. |
The selected hypothesis is explained on the screen, and the choice matters:
- All factors are active : Audze-Eglais criterion alone: complete space filling. To be selected if the downstream model uses all factors; ;
- Only a few factors are active : Audze-Eglais + MaxPro: also meets expectations in situations where the outcome depends on just two or three factors.
💡 This is the setting that really distinguishes between the two fill patterns, and it’s determined by considering the next step. If you suspect that two out of eight factors account for the bulk of the variation, a plane that fits the eight-dimensional space well may project very poorly onto the plane of those two factors; the points overlap on that plane, and the model can hardly distinguish anything there. This is precisely what the MaxPro term corrects.
⚠️ The correlation barrier is recommended: the MaxPro term significantly degrades correlations when it is not used. Disabling it only makes sense if you want maximum filling without worrying about the independence of the effects.
3. Calculate and read the result
The button Calculate Start the annealing process in a worker, with a progress bar and a button Stop. The resulting plan is saved in the experiment plan: it remains intact even after navigation.
Three indicators appear next to the button:

- Audze-Eglais : the fill factor—the lower it is, the better the area is covered; ;
- MaxPro : the projection fulfillment criterion, displayed when the «a few active factors» assumption is selected; ;
- Max |r| : the strongest absolute correlation between two factors.
The button Correlation matrix poster:

The button Point clouds offers two complementary interpretations:
- the matrix of the correlations between factors, on a fixed scale from −1 to +1 — a well-optimized plan therefore appears nearly neutral, which is correct
- and the scatter plots by factor pairs, which show why A weak correlation: points are well spread out, or there is a diagonal pattern.
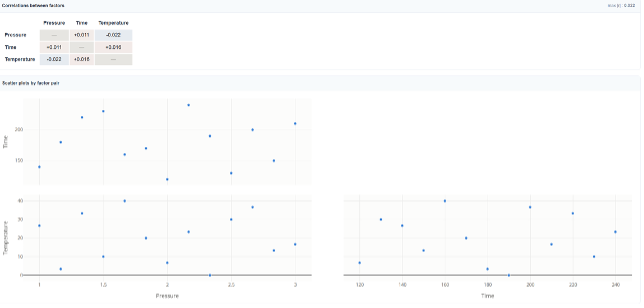
💡 The fixed scale of the matrix is not a configuration error. A scale adjusted to the data would display correlations of a few hundredths in bright colors, giving the false impression of a poor plot. Here, a nearly orthogonal plot is clearly visible as such.
⚠️ The button D-Optimal is intentionally omitted from filling plans: searching for a D-optimal subset of a filling plan is meaningless, since the plan aims to cover the space rather than to estimate a given model.