


Many of the Data Analysis features aren't listed in a menu on the page: they're under the right mouse button. This is intentional; the grid is a complex tool, and placing each command in a toolbar would make it unreadable.
1. In the grid
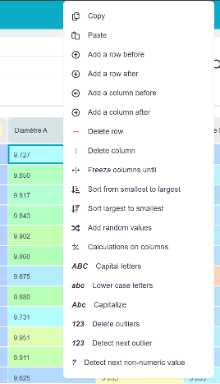
Right-clicking on a cell, a selection, or a column header opens the context menu. It contains four categories.
Edition
| Control | Effect |
| Copy, Paste | Clipboard, compatible with Excel. |
| Add a line before / after | As many lines as there are in the selection. |
| Add a "Before/After" column | The same goes for the columns. |
| Delete the line, Delete the column | Clear selection. |
Formatting and Navigation
| Control | Effect |
| Freeze the columns up to this point | Keeps the first few columns visible as you scroll. The same command unhides them. |
| Sort from smallest to largest / from largest to smallest | Sorts the rows by the selected column, moving the selected columns along with it. |
Generation and Calculation
| Control | Effect |
| Add random values | Fills the selection according to a specified rule—useful for training and for testing an analysis. |
| Column Calculations | Creates new columns containing statistics calculated based on the selected columns. |
Data Cleaning (the most useful family in everyday life):
| Control | Effect |
| Uppercase / Lowercase / Capitalize | Standardizes the case of a column of terms. |
| Remove outliers | Deletes values detected as outliers in the selected columns. |
| Detect the next outlier | Move the cursor to the next outlier. Display the message «No outliers detected» if there are no more. |
| Detect the next non-numeric value | The same principle applies to a text value dragged into a measure column. |
💡 The two commands for detection are better than their «delete» counterparts. An outlier—whether it’s a piece of information, a data entry error, an incident, or a non-conforming part—must be reviewed before a decision is made. The “detect, understand, then act” approach prevents the bulk deletion of data that should have been explained.
⚠️ Sorting reorganizes the rows in the selected columns. If your columns form a single unit—one row equals one item—select them all before sorting; otherwise, you'll separate the measurements for the same piece and won't be able to match them up again.
2. In the tables for the rest of the module
Ellistat's tables—projects, Gage R&R studies, various lists, and more—can also be accessed by right-clicking:
- on a column header : Sort in ascending order, Sort in descending order, Show / Hide Filters ;
- on a editable cell : Duplicate, which copies the value to the desired rows.
The ⋮ menu in these tables also contains Export CSV and Export to Data Analysis.
3. Keyboard Shortcuts for the Grid
| Shortcut | Effect |
| Ctrl + C / Ctrl + V | Copy / Paste |
| Ctrl + Z / Ctrl + Y | Undo / Redo (also available as buttons above the grid) |
| Ctrl + F / Ctrl + H | Find / Replace |
| Ctrl + D | Copy down |
| Ctrl + R | Copy to the right |
| Ctrl + A | Select All |
| Ctrl + arrow keys | Go to the last cell with data in that direction |
| Shift + arrow keys | Expand the selection |
| Tab / Shift + Tab | Next / Previous Cell |
| Entrance | Validate and proceed |
| Esc | Deselect |
| Delete / Backspace | Clear the selected cells |