


With several quantitative Y variables, two representations emerge, both of which are multivariate:
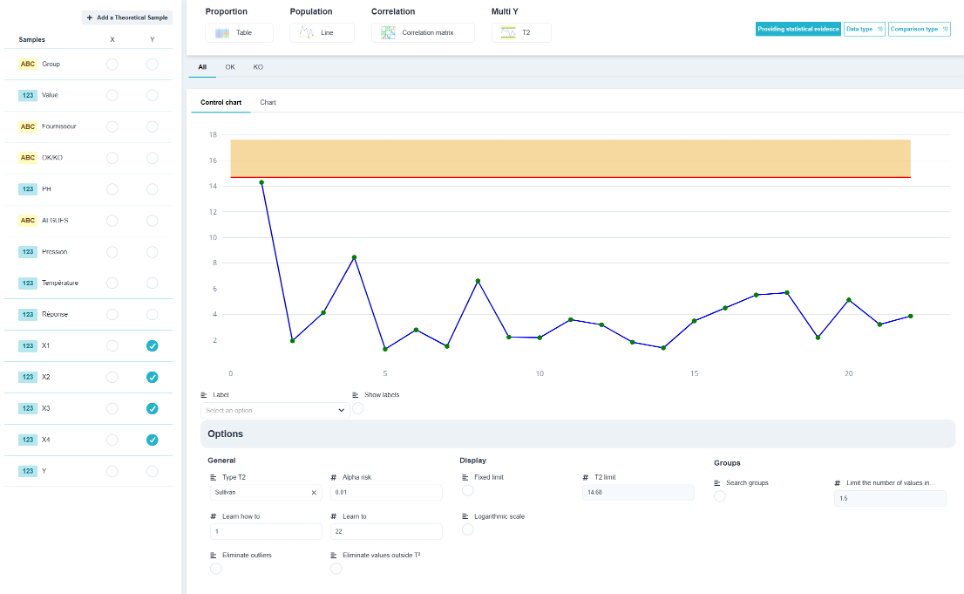
- T² : monitors all characteristics as a whole. It detects non-standard parts based on the *combination* of their dimensions, even when each dimension is within tolerance.
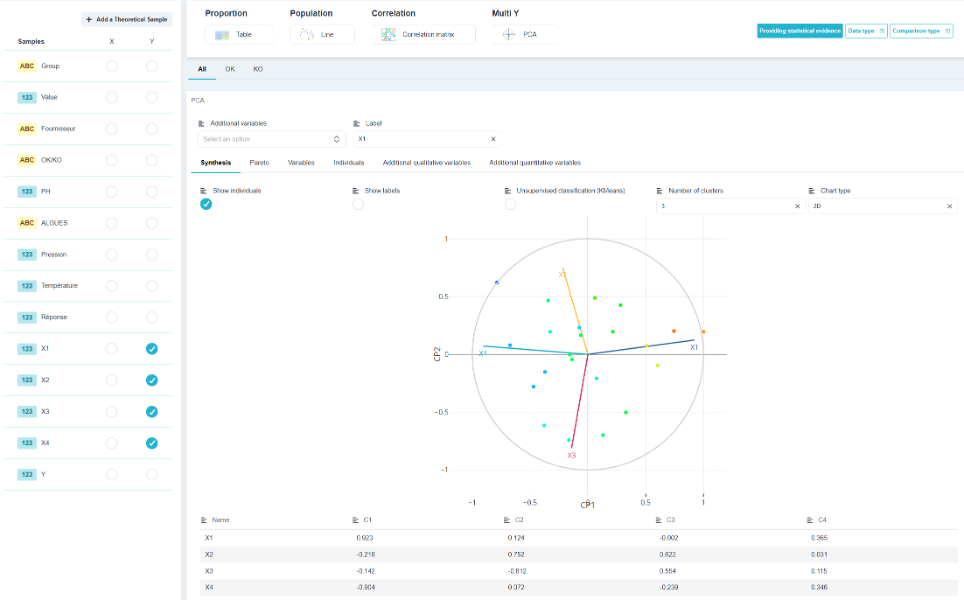
- ACP : summarizes the correlated Y variables along a few axes and shows their relationships on the correlation circle.
These two tools each have their own, more comprehensive menu => see the guide Multivariate Statistics. Their presence here lets you take a look at them without leaving the current selection.