Module details menu Data Analysis Ellistat allows you to perform descriptive statistics calculations, which consist in summarizing and describing the important characteristics of a data set.
Statistical indicators
Statistical indicators generally include measures of central tendency such as the mean and median. These statistical indicators give an idea of the typical value of a data set. They also include measures of dispersion such as standard deviation, dispersion and quartiles, which indicate the variability of the data.
Graphics
Graphs can also be used to summarize the distribution of data, for example using histograms, probability lines such as Henry's line, whisker box diagrams or control charts.
Capability indicators
Capability indicators, such as Cp, Cpk, Pp and Ppk, represent a category of statistics that assess the ability of a process to produce results in line with specifications. They can be used to quantify a process's ability to meet established quality requirements. Using these indicators, it is possible to estimate the potential non-conformance rates that a process could generate.
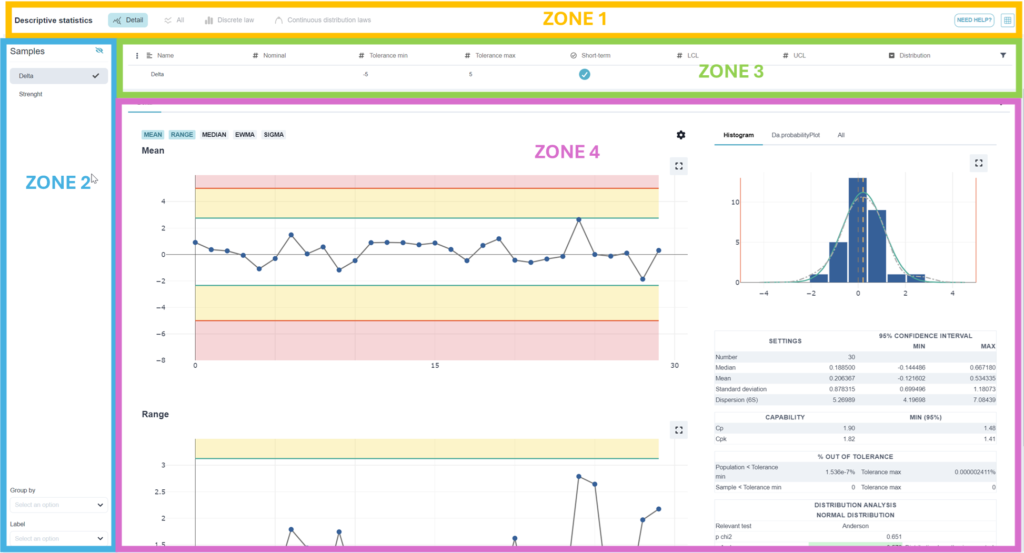
The "details" page can be divided into 4 zones:

Zone 1The list of submenus for descriptive statistics. It includes the following options: Details, Overall ratio, Discrete laws and Continuous laws.
Zone 2The list of answers and filters. At the top of this list, you can select the answer you wish to study, while at the bottom, you can apply filters to this same answer. These filters are useful when improving a process, or when you have several data collection contexts (before/after).
Zone 3 This zone contains all the information entered in the information zone on the grid page.
Zones 4 The descriptive statistics report.
The following video shows how to obtain the various statistics with Ellistat Data Analysis software:
Export results
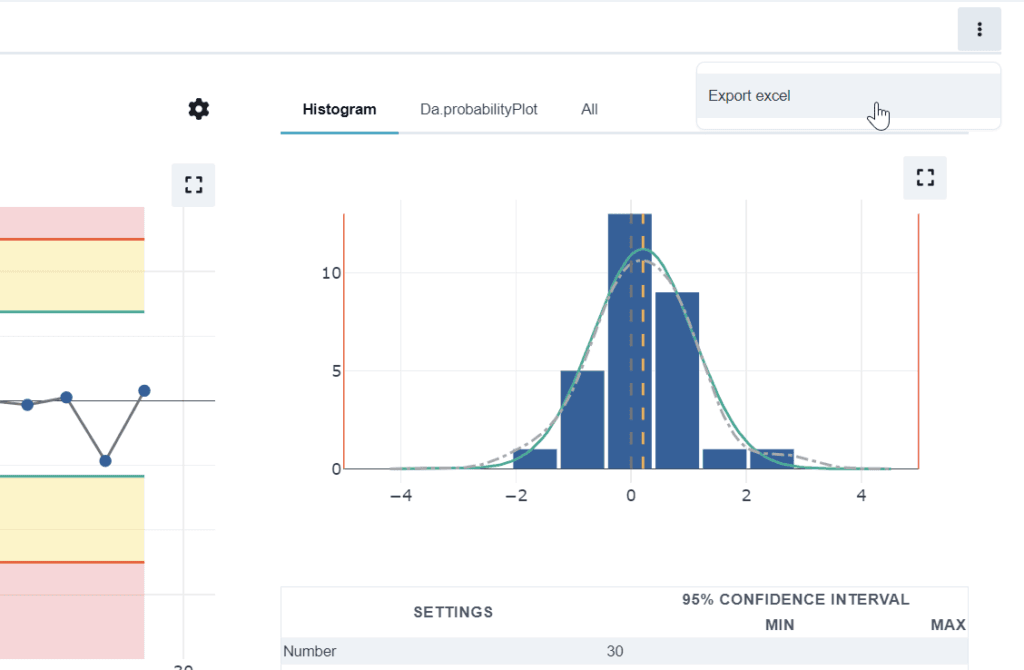
By clicking on the menu at the top right of the "details" page, you can export the descriptive statistics report in Excel format.

⚠️ In the "filter" area of the "grid" page, another option allows quick access to the descriptive statistics page by clicking on the "Descriptive statistics" button below.

Modify control card rules
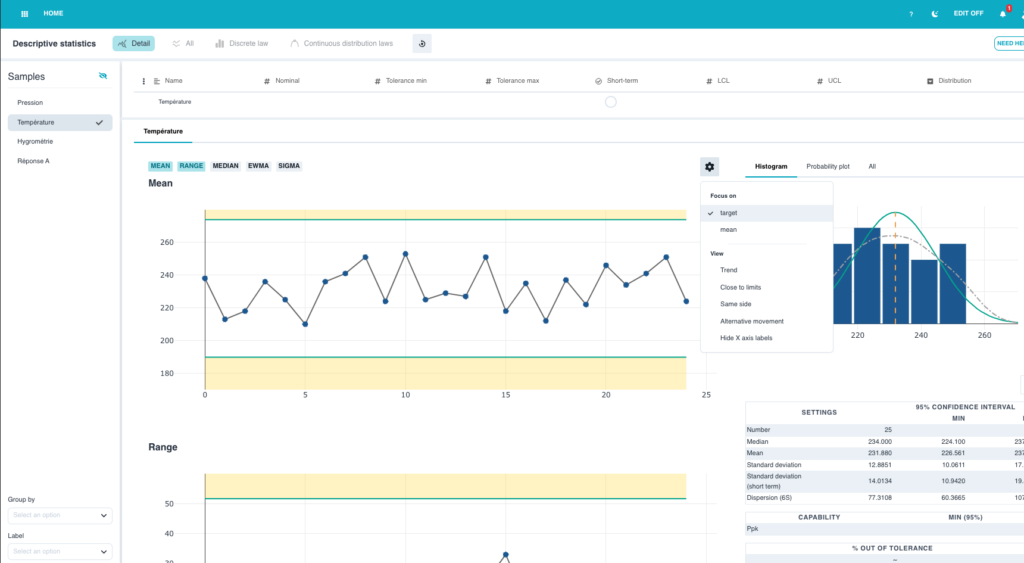
To change the target or rules used in the control chart display, click on the option button at the top right of the control chart:

The following rules can be used in Data Analysis:
- Trend: 7 consecutive points of increasing or decreasing trend
- Close to the limits: 1 point between 2 and 3 standard deviations
- Same side: 7 consecutive points on the same side of the target
- Alternating motion: 14 consecutive points in alternating motion
