Analyzing the results of a design of experiment is a crucial step in understanding and optimizing industrial processes. The Data Analysis fromEllistatEllistat's Data Analysis software offers a powerful and intuitive analysis menu for interpreting DOE (Design of Experiments) results. The analysis menu in Ellistat's Data Analysis software lets you explore the effects of factors, model responses, and optimize operating conditions. Here's a detailed explanation of the analysis menu in Ellistat Data Analysis.
To understand how the "Analysis" menu works. The following data set will be used: DOE Taguchi data

- Click on the "DOE"then click on the map "Analyze DOE.
- Zone 1 Selects the correct grid and the name of the Y answer defined in zone 2.
- Zone 2 Select the response variable Y and the explanatory factors X.
Example Select "NC(%)" as Y variable and "Temperature", "Concentration" and "Speed" as X variables. - At the bottom of this area, you can also select the desired modeling method (e.g. linear regression, PLS, or K-OPLS).
- Zone 3: Contains several tabs presenting different analyses, such as :
- model coefficients,
- residue analysis,
- graphics,
- or a forecasting tab.
💡 Zone 3 contains several tabs: ⇒ "Coefficient" tab: the diagram below summarizes the data presented.

⇒ "Effects graphs or Taguchi graphs" tab: these graphs are obtained only in the case of a Taguchi experimental design. They show the effects of factors and interactions.

⇒ "Model/observations graph" tab: allows you to graphically compare values obtained with the model and observed values.

⇒ "Residual analysis" tab: allows you to check the normality of residuals with the residuals descriptive statistics report.

⇒ "Residuals" tab: Table with various data such as individual residual values, model values or observed values.
⇒ "Forecast" tab: With this tool you can make forecasts or optimizations using the prediction menus (target, maximize or minimize).

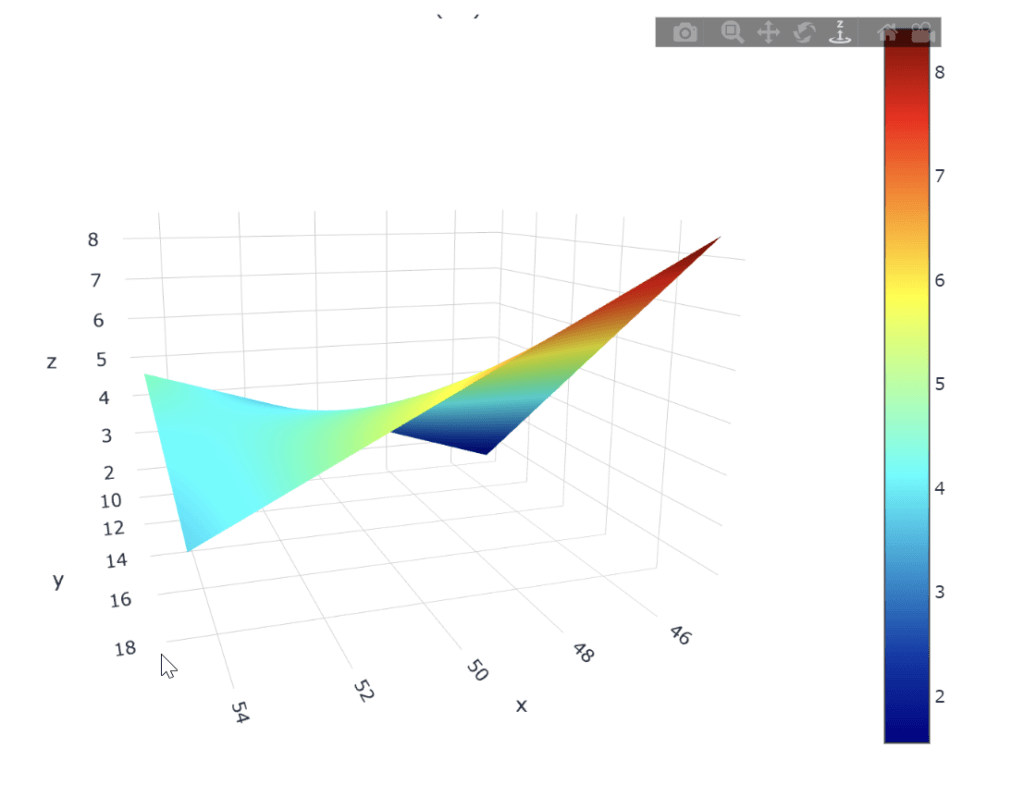
⇒"3D" tab: displays the model in 3D or as a temperature graph.