


Before beginning mass production, every quality team must answer a fundamental question: Is my process physically capable of producing within specifications? This is not a matter of adjustment or alignment. It is a matter of raw potential.
That is precisely what the’Cp index, one of the most widely used indicators in statistical process control (SPC). Like any summary measure, it has specific limitations. It is important to be aware of these limitations to avoid drawing erroneous conclusions.
What the Cp Actually Measures
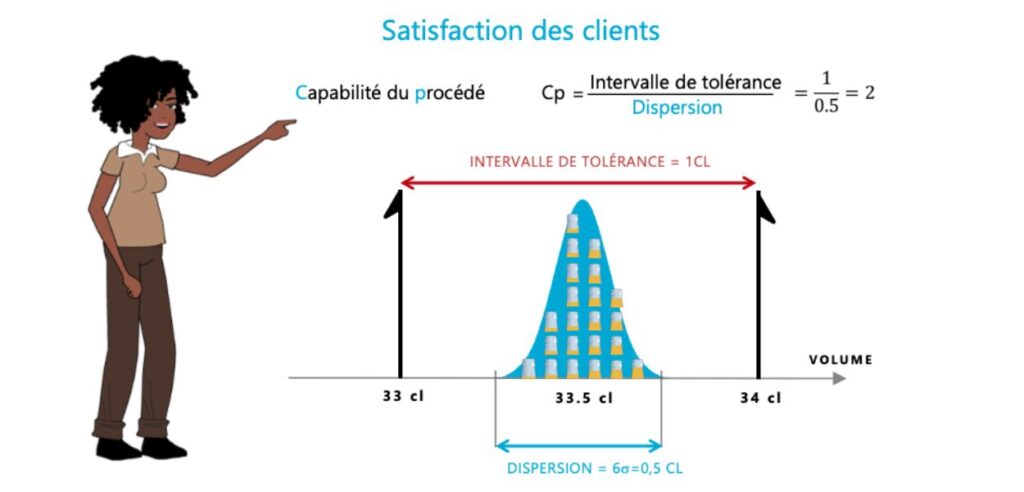
The Cp, or process capability index (Process Capability), compares the tolerance range defined by the engineering department with the dispersion measured in the process. The formula is simple:
Cp = (LSS − LSI) / 6σ
- LSS is the upper specification limit.
- LSI is the lower specification limit.
- 6σ represents the range of natural variation in the process, or ±3 standard deviations around the mean.
Specifically, if your tolerance is twice as wide as your process variation, the Cp is 2.0. If the two are identical, it is 1.0. In this case, even with a perfectly centered process, approximately 0.27% of production will statistically fall outside the tolerance limits.
What Cp value should you aim for?
The most common industrial reference point is Cp ≥ 1.33 : The tolerance is at least 1.33 times wider than the process variation. In demanding industries such as the automotive and aerospace sectors, a threshold of 1.67 or even 2.0 is often required for critical characteristics.
| Cp Value | Reading |
|---|---|
| Cp < 1 | The dispersion exceeds the tolerance: the process cannot meet the specification, even when perfectly adjusted |
| 1 ≤ Cp < 1.33 | Limit potential: even the slightest deviation or misalignment results in nonconforming parts |
| 1.33 ≤ Cp < 1.67 | Satisfactory potential for a standard characteristic |
| Cp ≥ 1.67 | Comfortable margin, as expected for critical characteristics |
Calculation criteria: an often-overlooked limitation
The Cp is calculated as short-term terms. A sample is taken during an initial capability study under deliberately controlled conditions: same operator, same material batch, same settings. The goal is to evaluate the process’s intrinsic potential, without the sources of variation found in the actual production environment.
This is both its strength and its weakness. Under ideal conditions, the Cp provides an upper limit on what the process can achieve. But it does not reflect what will happen during long-term production:
- tool changes;
- variations in raw material batches;
- shift rotations;
- thermal drifts.
These sources of variation are simply not taken into account in the calculation.
That is the role of the Pp. Same formula, but calculated using the overall standard deviation for a representative production period. Comparing Cp and Pp is a useful initial diagnostic tool:
- a Pp that is significantly lower than the Cp indicates a process that has potential but is not stable over time;
- a Pp close to Cp indicates that the process remains stable under actual production conditions.
The "Centering Trap": When a Good Cp Hides Poor Parts
This is the point that is most often misunderstood in the field. A high Cp simply means that The process variation is small relative to the tolerance. It says nothing about the position of this scatter relative to the target.
Let’s consider a tolerance of 10 ± 0.5 mm and a process whose natural variation spans 0.6 mm. The Cp is 1 / 0.6 ≈ 1.67: on the surface, this seems excellent. But if the process is centered at 10.4 mm instead of 10.0 mm, the parts will range up to 10.7 mm. A large portion of the production will then exceed the upper limit, despite a very good Cp.
To measure this skewness, we use an index that takes into account both the dispersion and the position of the mean. It is calculated as the distance between the mean and the nearest outlier, divided by three standard deviations. In our example, it comes out to (10.5 − 10.4) / 0.3 ≈ 0.33.
At Ellistat, this index is the Ppk, calculated based on overall production variability. We have chosen not to use Cpk as a control metric, since it relies solely on short-term variability and often paints an overly favorable picture of the process. The reasons are detailed in our article Cpk and Ppk: Why Ellistat Chose Not to Calculate the Cpk.
This makes it easy to read:
- a significant difference between Pp and Ppk indicates a centering issue, which should be corrected by adjusting the setting;
- a Pp and a Ppk that are close to each other and both satisfactory indicate a capable, stable, and focused process.
How to Use the Cp Rigorously
- Check for stability before performing the calculation. A Cp calculated based on an unstable process, with special causes detected in a control chart, has no statistical significance. Stability is a prerequisite, not an option.
- Specify the measurement method. The observed dispersion includes measurement dispersion. A measurement method with excessive dispersion artificially worsens the Cp. A study R&R bonus Addressing the issue early on prevents a process from being wrongly rejected.
- Check the shape of the distribution. The Cp formula is based on the assumption of a normal distribution. For clearly skewed data, first test this assumption using a normality test.
- Ensure that the sample is representative. Collect at least 30 to 50 consecutive samples under consistent conditions.
- Never interpret it on your own. The Cp indicates whether the process may Maintain tolerance. The PPK indicates whether it is maintained. actually. Schedule an assessment of Pp and Ppk based on long-term data after the first few weeks of production. The method is detailed in our article on Calculating the Cp, Pp, and Ppk indices.
Conclusion
L’Cp index is a powerful diagnostic tool, provided you ask the right question: Does this process have the dimensional capability to meet the tolerance? To determine whether it actually meets the tolerance in production, you need to dig deeper:
- the Pp measures stability over time;
- the Ppk measures actual performance, including centering.
Together, these three metrics form a coherent dashboard of capability, which should never be interpreted in isolation.
FAQ
What is the formula for Cp?
Cp = (LSS − LSI) / 6σ. The tolerance width is divided by six standard deviations of the process, calculated under short-term conditions.
What is the difference between Cp and Pp?
Both use the same formula. The Cp uses short-term dispersion, measured under steady-state conditions, and describes the process’s potential. The Pp uses the overall dispersion over a representative production period and describes its actual stability over time.
Does a good CP guarantee that parts are compliant?
No. The Cp does not account for the mean. A process with very little variation but poor centering can have an excellent Cp and still produce parts that are out of tolerance. The Cp must be supplemented with an index that accounts for centering, such as the Ppk.
What Cp value is acceptable?
A CP of at least 1.33 is the most common threshold for a standard characteristic. Critical characteristics—particularly in the automotive and aerospace industries—often require a CP of 1.67 or higher. The exact threshold is determined in consultation with the customer.
How many parts are needed to calculate a Cp?
At least 30 to 50 consecutive units, sampled under consistent conditions from a stable production process.