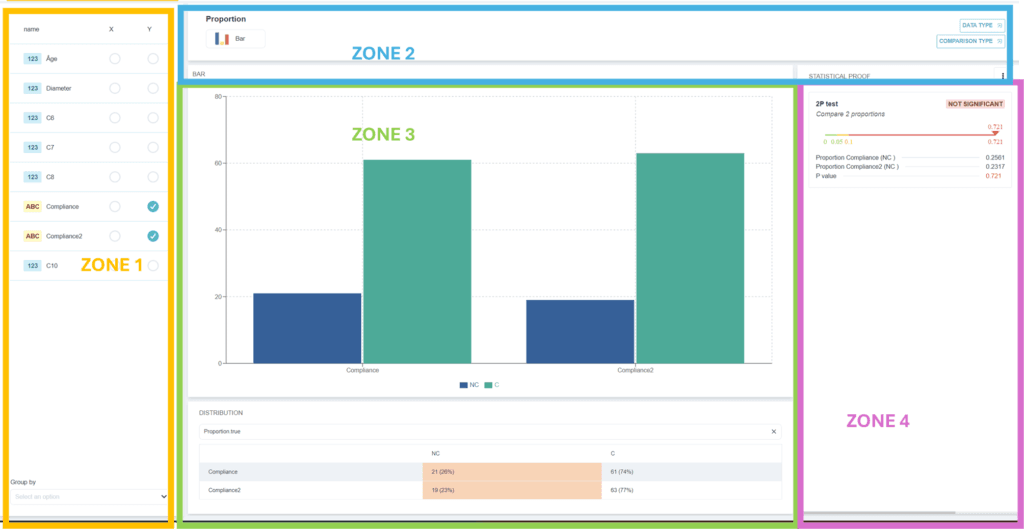
Ellistat Data Analysis offers a complete range of statistical tests for comparing proportions. Three main tests are available for this purpose:

- Simple proportion test (1P): Ideal for comparing a proportion with a reference value or a specific hypothesis.
- Proportion test (2P): Useful for comparing two proportions, highlighting significant differences between two groups or populations.
- Chi2 test for multiple proportions: Suitable for simultaneously comparing the proportions of several groups or categories, enabling robust and detailed comparative analysis.
Comparison of proportions
Below is a summary of the proportion comparison analyses proposed by Ellistat Data Analysis. Let's take the example of the following qualitative data: Proportion
Several analyses can be performed on this dataset.
Example: Performing a 1P test to compare a proportion with a reference value
To compare a proportion with a theoretical target.

- Put qualitative data with two modalities in the grid. (in the above example 61C/ 21NC).
- Click on the "Inferential statistics" menu.
- In the zone 1select the column with qualitative data in Y.
- In zone 2, choose your data type. By default, if your column contains qualitative values, Ellistat will propose "Proportion" only, but if the data is quantitative, Ellistat will propose both "proportion" and "population" types. 📝: choose "Proportion" in the case of 1P, 2P or Chi-2 tests, or choose the "proportion" type.
- In zone 3to obtain the graphics selected in zone 2.
- In the zone 4The significance result is displayed on the right, with the various statistics below. (the difference between the proportion and the theoretical proportion is significant if the value of P is less than 0.05 in the following case we can conclude is significant). 📝: The content of zone 4depends on the type of data selected in Zone 2. In the case of 1P, 2P or Chi-2 tests, choose the "proportion" type.

Example: Performing a 2P test to compare two proportions P1 and P2
To compare the proportions of two populations.

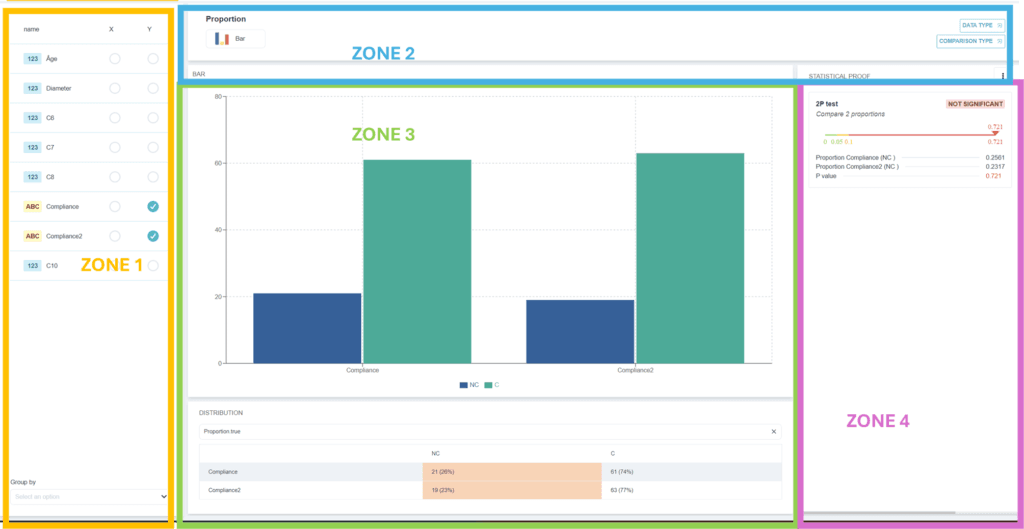
- Put in a column of the grid qualitative data with two modalities. (in the above example "compliance": 61C/ 21NC , "compliance 2": 63C/19NC).
- Click on the "Inferential statistics" menu.
- In the zone 1choose in Y the two columns "compliance" and "compliance 2" with qualitative data.
- In zone 2, choose your data type. By default, if your column contains qualitative values, Ellistat will propose "Proportion" only, but if the data is quantitative, Ellistat will propose both "proportion" and "population" types. 📝: choose "Proportion" in the case of 1P, 2P or Chi-2 tests, or choose the "proportion" type.
- In zone 3to obtain the graphics selected in zone 2.
- In the zone 4The significance result is displayed on the right, with the various statistics below. (the difference between the proportion and the theoretical proportion is significant if the value of P is less than 0.05 in the following case we can conclude is significant). 📝: The content of zone 4depends on the type of data selected in Zone 2. In the case of 1P, 2P or Chi-2 tests, choose the "proportion" type.
Example: Perform a Chi-2 test, to compare the proportions of several groups or categories simultaneously.
To compare the proportions of two populations.

- Put qualitative data with two modalities in a column of the grid. (in the above example "compliance": 61C/ 21NC , "compliance 2": 63C/19NC and "compliance 3" :38C /44 NC)
- Click on the "Inferential statistics" menu.
- In the zone 1choose in Y the 3 columns "compliance", "compliance 2" and "compliance 3" with qualitative data.
- In zone 2, choose your data type. By default, if your column contains qualitative values, Ellistat will propose "Proportion" only, but if the data is quantitative, Ellistat will propose both "proportion" and "population" types. 📝: choose "Proportion" in the case of 1P, 2P or Chi-2 tests, or choose the "proportion" type.
- In zone 3the graphics selected in Zone 2.
- In the zone 4The significance result is displayed on the right, with the various statistics below. (the difference between the proportion and the theoretical proportion is significant if the value of P is less than 0.05 in the following case we can conclude is significant). 📝: The content of zone 4depends on the type of data selected in Zone 2. In the case of 1P, 2P or Chi-2 tests, choose the "proportion" type.
