Visit statistical power is a measure used in statistics to evaluate the ability of a statistical test to detect a real effect, if it exists. In other words, it is the probability that a statistical test will correctly reject a false null hypothesis.
With Ellistat's power menu Data Analysisyou can perform two calculations:
- Calculation of minimum sample size to achieve desired statistical power.
- Calculation of statistical power for a given sample size.
These two calculations are very important for obtaining statistically valid results.
Ellistat Data Analysis provides power calculations for a wide range of statistical tests. The list below shows the statistical tests concerned:
| Statistical test | |
|---|---|
| Z-test | One T-test |
| Two T-test | Two T-test for paired data |
| ANOVA | Chi2 test ( SD vs target) |
| Fischer test (SD1 vs SD2) | Test one proportion |
| Two-proportion test | DOE 2k (experimental design) |
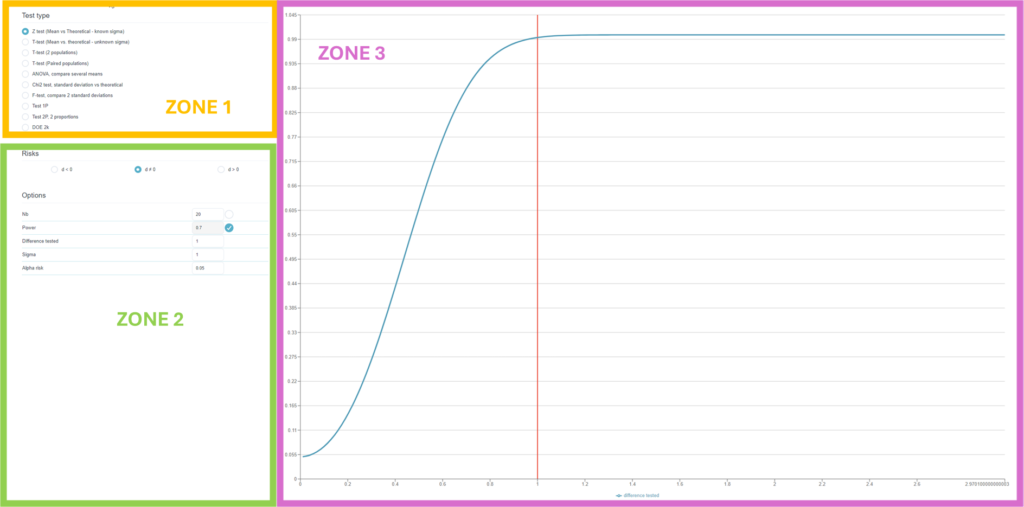
The "Statistical power" page consists of 3 areas:

⇒ Zone 1 : choice of hypothesis test zone.
⇒ Zone 2 Input field for power calculation information. Its content depends on the statistical test selected. It contains information such as the type of hypothesis test, the desired statistical power, the difference or ratio tested, the standard deviation, the alpha risk, the number of groups, etc.
⇒ Zone 3: Graph showing the evolution of statistical power as a function of the difference tested (for tests comparing means or proportions) or as a function of the ratio (for tests of variances).
Example: Calculating statistical power with Ellistat
To calculate statistical power.

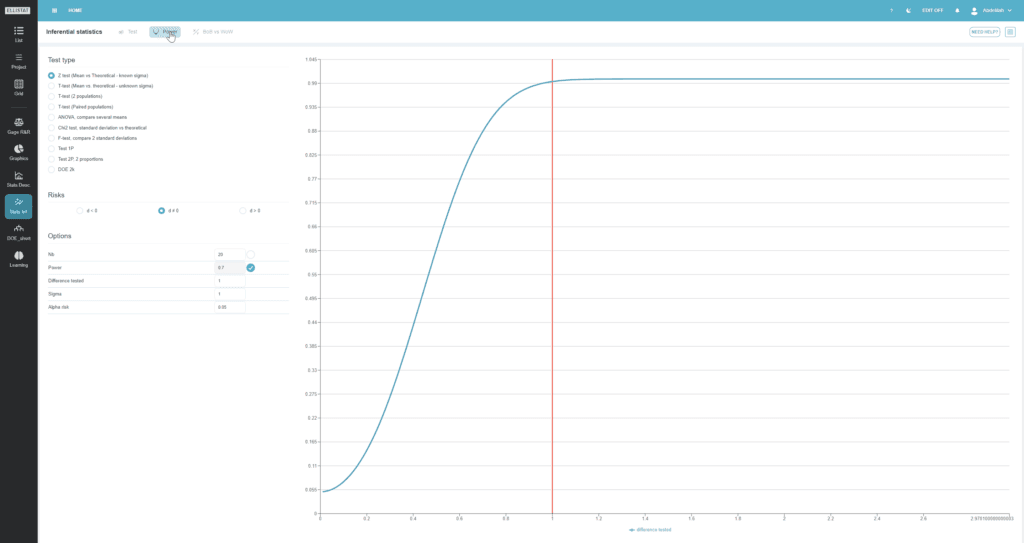
- Click on the "Inferential statistics" menu.
- In the horizontal bar: click on the "Power" submenu.
- In the zone 1 In "Test types", choose a statistical test. In our case, we chose the "T-test (2 populations)".
- In the zone 2 , fill in the power calculation information.

⇒ Choice of alternative hypothesisChoose the alternative hypothesis to be tested.
In the case of hypothesis tests designed to compare averages, it is differences that are being tested.

In the case of hypotheses designed to compare standard deviations, variance ratios are tested.

In the case of hypothesis tests, which aim to compare proportions, differences in proportions are tested.

⇒NB: Number of samples. If the box on the right is checked, the sample size is calculated for a given power, and if not, it is used as an input for calculating statistical power.

⇒ Statistical power (1- Beta) Set the value of statistical power. This is the probability of rejecting the null hypothesis. (For example, the hypothesis that the groups are identical with regard to a variable). Knowing that the null hypothesis is incorrect (in reality, the groups are different).
⇒ Sigma Set the value of the standard deviation here, to perform the power calculation.
⇒ Alpha riskRisk of rejecting the null hypothesis, when in fact it is true - a "false positive". The alpha value most commonly used in industry is 5%.
In the zone 3Ellistat will plot the evolution of power as a function of the difference in mean tested, the ratio of standard deviations, or the reference proportion.
The coordinates of the plotted point are the difference tested (the ratio in the case of standard deviations or the reference proportion for proportions) on the abscissa and the statistical power on the ordinate.
Special cases :
In the case of an analysis of variance (ANOVA), which is used, for example, to compare several averages. In addition to the elements detailed above, another field appears in zone 2.
⇒ Number of groups : enter the number of groups compared in this field.
