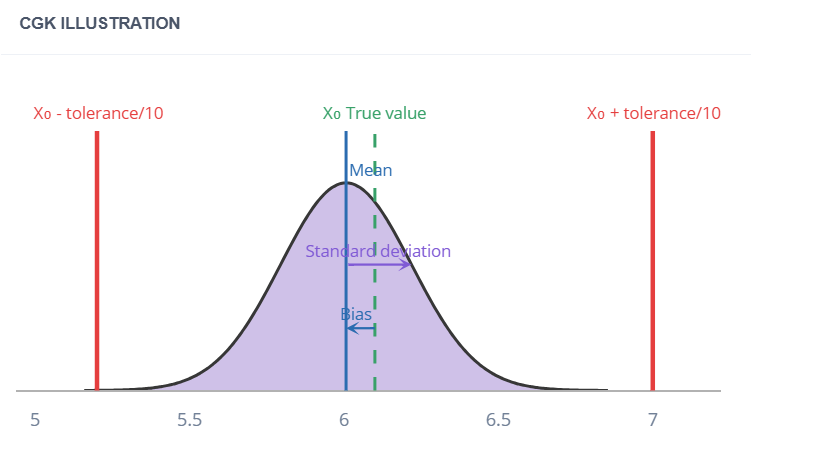
Accuracy compares repeated measurements of a coin of known value from this true value. It distinguishes between two errors: the systematic bias (the accuracy deviation) and the dispersion (repeatability).
1. What you need to know:
- Visit true value X₀ of the calibrated part; ;
- the tolerances minimum and maximum values of the characteristic; ;
- the resolution of the instrument; ;
- the repeated measurements on the same part, by a single operator.
💡 Aim at least 25 measurements. If the value is below 10, the study is not usable: the standard deviation calculated from such a small number of values is itself too uncertain.
The study is also being conducted from the gate if the measurements have already been entered there.

2. Statistical Results
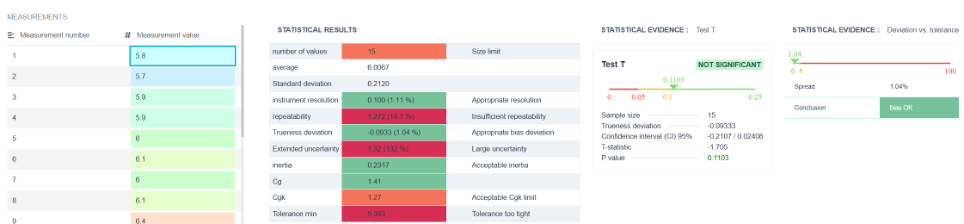
The Results tab displays each indicator with a color code : green = compliant, orange = borderline, red = insufficient. The thresholds applied are as follows.
| Indicator | Green | Orange | Red |
| Number of values | ≥ 25 | ≥ 10 | < 10 |
| Resolution | ≤ tolerance / 20 | ≤ tolerance / 10 | beyond |
| Repeatability (2kσ) | < 5 % of the tolerance | < 10 % | ≥ 10 % |
| A narrow margin | ≤ tolerance / 20 | ≤ tolerance / 10 | beyond |
| Expanded Uncertainty | ≤ 15 % of the tolerance | — | beyond |
| Inertia | ≤ tolerance / 30 | — | beyond |
| Cg and Cgk | > 1.33 | > 1.00 | ≤ 1.00 |
| Minimum tolerance range | below tolerance | — | higher |
- The Margin of Accuracy is the difference between the average of the measurements and the true value. This is systematic error: it can be corrected.
- Repeatability is the instrument's dispersion across a single piece. It cannot be corrected by adjustment.
- Inertia combines the two into a single figure: the square root of (accuracy deviation² + repeatability²). This is the key metric to consider when making a single decision, since a measurement error carries the same weight whether it results from a shift or from dispersion.
- The minimum tolerance interval Let's look at it the other way around: with this instrument, what is the tightest tolerance you can reasonably expect to control? If it exceeds your tolerance, the instrument is unsuitable for the part.
3. Cg and Cgk
These are the capabilities of the measuring instrument, defined in the same way as process capabilities but over a reduced interval—one-tenth of the tolerance.
- Cg looks only at the dispersion; ;
- Cgk also includes the offset from the true value.
A normal Cg level with a low Cgk level indicates an instrument accurate but out of tune : to be calibrated, without changing the equipment. If both Cgk and Cg are low, this indicates an instrument too scattered : In that case, we need to change our approach or method.
💡 The usual threshold is Cgk > 1.33. The screen also displays the minimum tolerance that would ensure this threshold.
4. The Charts
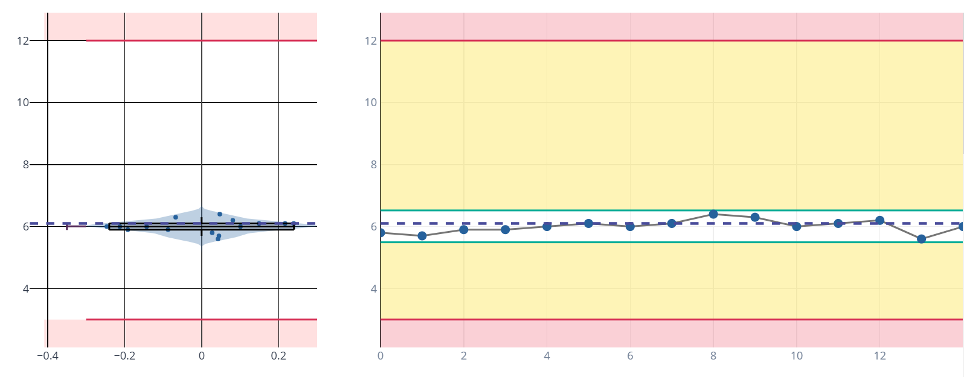
- The accuracy graph plots the measurements around the true value and the tolerance interval.
- Visit control chart shows the sequence of measurements: a slow drift is visible here, even though it is masked by the average.
- The’Illustration by Cgk Plots the mean, the true value X₀, and the bounds X₀ ± tolerance/10: it visually illustrates what the number represents.