


This page takes the analysis a step further: it breaks Nevada down into zones and presents the results in the form of control charts, to detect deterioration before it becomes visible in the cumulative data.
The tracking maps provided by Ellistat Data Analysis are an indispensable tool for tracking progress in reliability, as well as production incidents, product comparisons, and more…
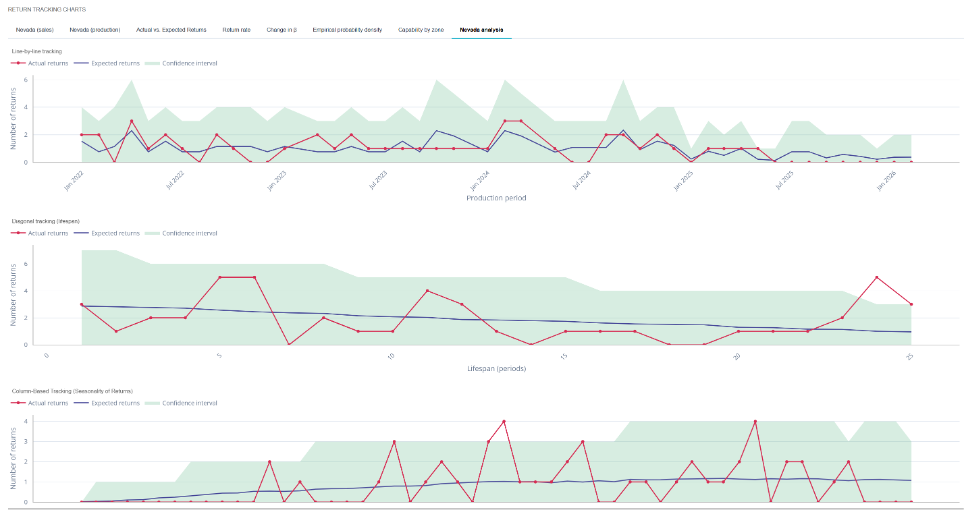
Tracking Methods :
- Diagonal Tracking (Lifespan) : tracks products of the same age. Answers the question, «Has aging changed?»; ;
- Tracking by Column (Seasonality of Returns) : Describes what happens during the same calendar period. Answers the question, «Did anything happen that month?»; ;
- Line-by-Line Tracking : Tracks each sales period separately. Answers the question, «Is this batch different?» If you use the production date as a reference, you can track production quality!
💡 These three readings do not detect the same problems. A material defect in a batch is visible online. A harsh winter is evident in columns. Accelerated wear is evident diagonally. Looking at all three helps us avoid attributing to age what is actually a matter of the calendar.
Settings:
- Elementary Period (days or months): the unit used to group sales and calculate product lifespan; ;
- Elementary Zone and elementary range : dividing Nevada into staggered sections that are used to construct the map; ;
- Window (time period) and number of periods.
Available maps:
| Map | What she follows |
| Return Rate | The observed proportion, along with its target 1 − expected reliability and its lower bound. |
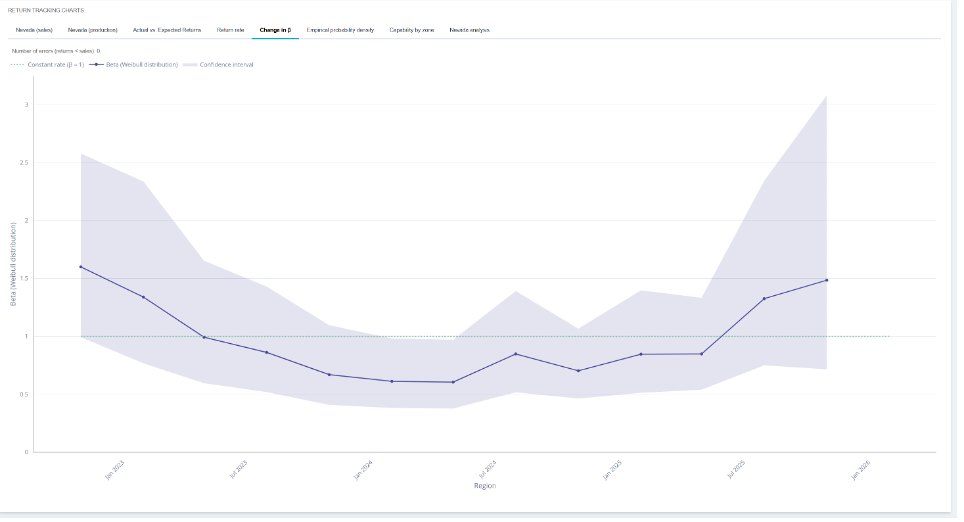
| Changes in β | The shape parameter, zone by zone. A shifting β indicates a change in diet failure. |
| Reliability by Region | Estimated reliability for each zone. |
| Empirical probability density function | The observed pattern of lifespans. |
| Nevada Analysis and Rebuilding Nevada | The triangle reconstructed based on your dates. |
The input accepts Sales / Return Dates, or the Production / Sale / Return Dates. This second form reconstructs two Nevada: one for production, one for sales for distinguish between aging in storage and aging in service.
💡 This distinction is particularly important for slow-moving products: a product that ages in the warehouse and one that ages at the customer’s location require different actions. Without production dates, the two situations are often confused.
⚠️ Ellistat reports the number of errors (returns < sales) : cases where the return date precedes the sale date. These are data entry errors that must be corrected, not ignored, because they distort the product lifespans.
The maps require a minimum amount of data: «No zones with at least 3 outliers» indicates that no β can be estimated for the selected grid. Expand the zones.