


The same principle applies to continuous laws: normal, natural logarithm, Weibull, exponential and beta.
Enter the settings of the law and the limits, and we get:
- the statistics : mean, median, first quartile; ;
- the proportion on the underside and the proportion of the upper side, the percentage of production that is out of specification; ;
- the capabilities Corresponding Cp and Cpk values, if applicable.
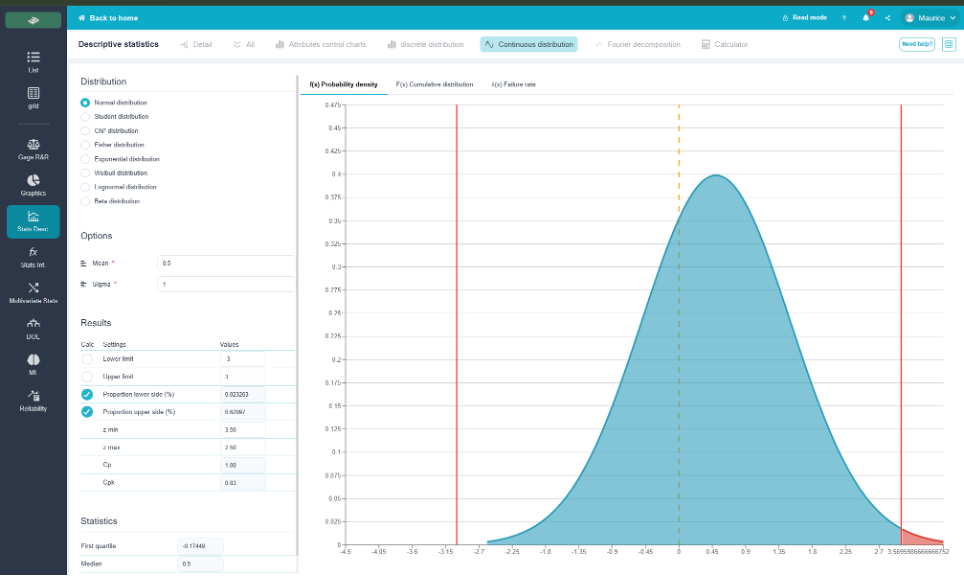
💡 The main benefit is that it replaces traditional statistical tables by providing all the statistics for the main distributions
💡 A secondary benefit is a priori sizing: before starting production, we verify what proportion of scrap results from an assumed dispersion and a given tolerance. This is also a good place to demonstrate the effect of misalignment on scrap.
⚠️ A distribution chosen for convenience does not become true. If the actual data do not follow a normal distribution, the proportion outside the tolerance range calculated under the assumption of a normal distribution may be significantly incorrect at the tails, where the difference between distributions is greatest.