


A product fails when the constraint that he is enduring exceeds his resistance. Since the two are independent, the failure probability is the probability of overlap between the two distributions.
This page estimates this rate based on the two laws. They can be defined by theoretical distributions or by experimental data.
For example, suppose we have a product for which we have calculated the failure distribution: Weibull, β(beta) = 1 and η (êta) = 15,000 cycles. It is estimated that the most demanding user will use the product for 30,000 cycles, the least demanding for 200, and the average user between 500 and 2,000, which is modeled as a trapezoid. The failure rate is then calculated. The estimated failure rate is 11%
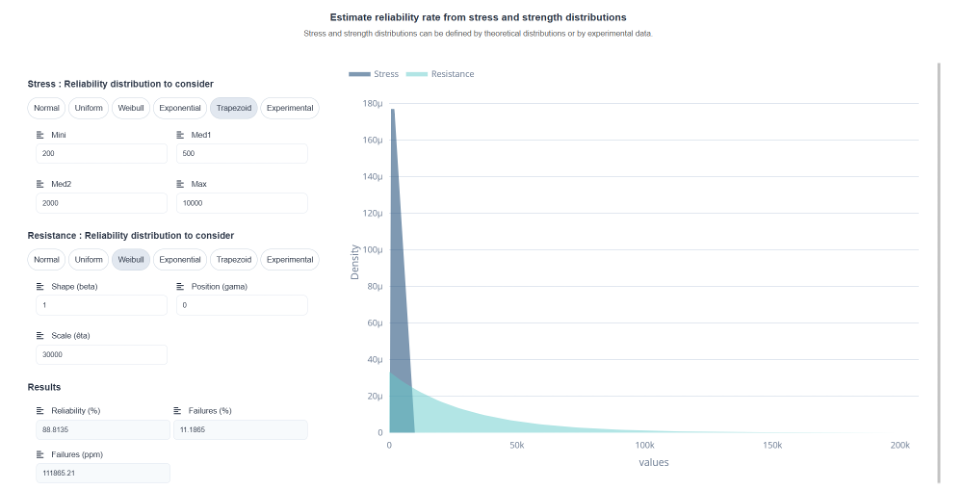
💡 This is the tool used for sizing during the design phase, when you don't yet have any feedback. It also reveals something counterintuitive: It is dispersion—rather than the mean—that determines failure. Increasing the mean resistance of 20 % is less effective than halving its dispersion, because it is the tails of the distribution that overlap.
⚠️ The result depends entirely on the tails of the two distributions—precisely where the data is scarcest and where the choice of distribution has the greatest impact. A rate calculated based on unverified distribution assumptions is an order of magnitude, not an exact figure.