


Once the reliability law has been established, this page compares the actual returns at Expected returns, calculated based on actual sales and the theoretical formula.
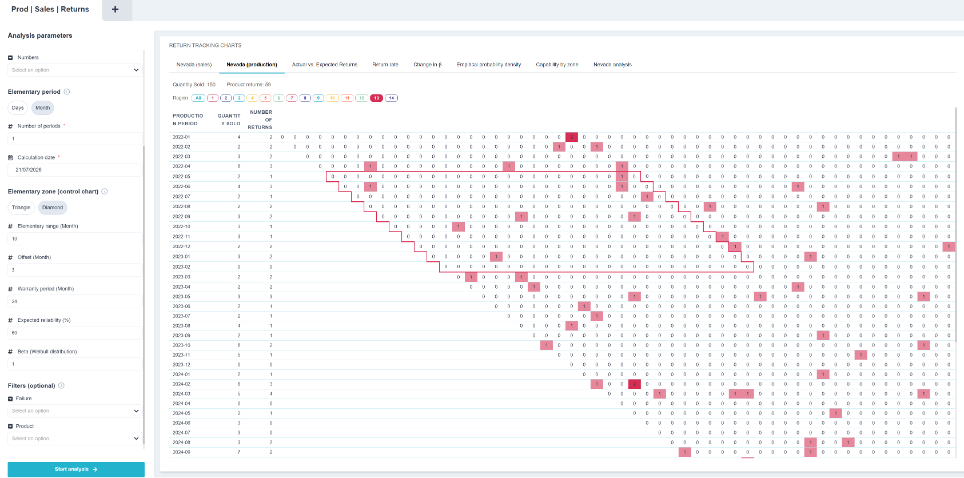
The monitoring system allows you to track production or sales periods on a rolling basis, as indicated on the Nevada. By tracking these different periods, you can gain a very clear picture of how product reliability has evolved.
Enter the reliability law to consider, the analysis end date and the warranty period, the latter being used to censor the data.
The graph Actual Returns vs. Expected Returns Overlay the two curves.
💡 This is the validity check for the model currently in use. Three readings:
- The curves overlap: the model holds up, and reliability is under control; ;
- actual returns exceed Reasons: Reliability is lower than expected: production variation, more severe usage, or an incorrectly estimated law; ;
- The actual returns are lower : This seems like good news, but first check to make sure all returns are being properly tracked. A customer service system that misses cases can give the same impression as an excellent product.