


R&R breaks down the observed variability into its sources and answers the following questions: How much of what I measure actually comes from the parts, and how much comes from my measurement system?
1. The Study Plan
Each piece is measured several times by each operator.
- The Parts must cover the actual range of production. Taking ten parts from the same tight series makes the measuring method appear flawed, when in fact it is the reference that lacks variation.
- Rehearsals measure repeatability: the same operator, the same part, twice. At least two are needed, A single repetition precludes the use of the ANOVA method.
- Operators measure reproducibility. At least two, preferably three.
💡 Get it measured in random order and without the operator seeing their previous measurements. Otherwise, they get their own result, and the repeatability achieved is impressive.
2. Create the study
There are three options, depending on the status of your data:
- Add an R&R requirement then Create an empty grid : Ellistat prepares the "parts × operators × repetitions" template; all you have to do is enter the data; ;
- Create from the grid if the measurements already exist in a table; ;
- Export to the grid to import data from a study into a spreadsheet and analyze it further.
Fill in the’measuring instrument, the operators, the tolerances and the selected standard (see § 8).
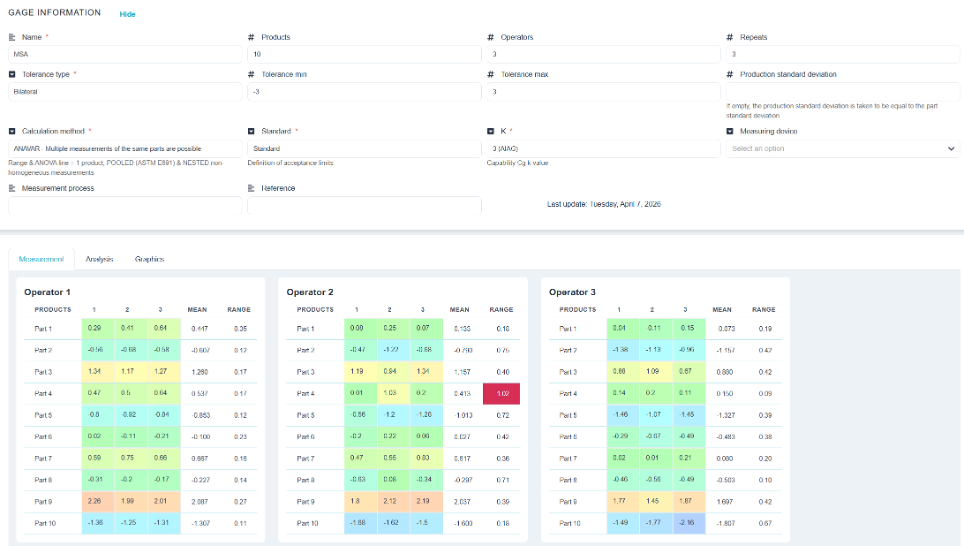
3. Measurement Tab
The data entry table consists of one row per part, one column per operator, and one column per repetition. All fields must be filled in: a message stating «Please fill in all values» indicates any missing entries.
4. Analysis Tab: Analysis of Variance
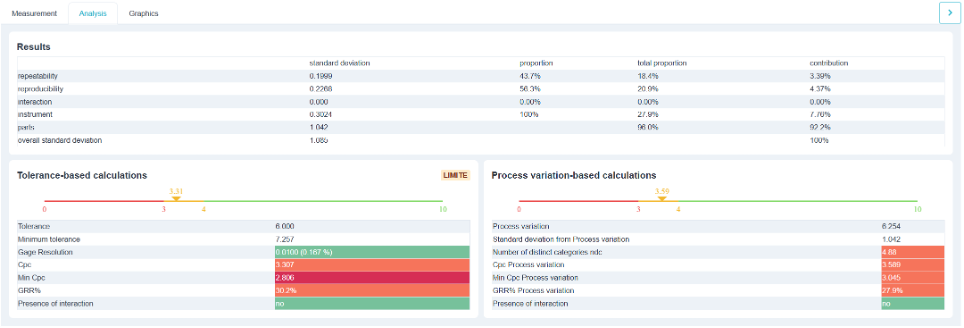
This is the core of the study. Each source of variation is assigned a standard deviation and a weight.
| Source | What It Represents |
| Parts | The actual variation between parts. That's the useful signal. |
| Repeatability | The instrument itself: same operator, same sample, different results. |
| Reproducibility | The operator: No two people are the same height. |
| Interaction | A particular operator behaves differently on certain parts. |
| Instrument (GRR) | Repeatability and reproducibility combined: the total error of the measurement system. |
| Overall standard deviation | All things considered. |
The Columns standard deviation, contribution, proportion and total proportion express the same thing on different scales: read the total proportion to place each source within the overall context.
- If the repeatability If the sound is too loud, the problem is with the instrument or the setup.
- If the reproducibility While this is the main issue, the problem lies in the procedure: operators do not follow the same approach. This is often the easiest thing to fix—through clear instructions and training.
- If the’interaction is significant, an operator is having difficulty with a specific type of part.
💡 The calculation method You can choose between ANOVA and means/ranges. ANOVA is preferable: it is the only method that can isolate the interaction. It requires at least two replicates; otherwise, Ellistat will display the message «ANOVA cannot be performed with 1 replicate.».
5. Results tab: two reference sets
The same measurement error can be interpreted in two ways, and Ellistat presents both side by side.
Regarding tolerance : The issue of inspection: Is my system capable of distinguishing between compliant and non-compliant items?
- Cpc : the control process capability, the primary indicator. It reflects the tolerance for variation in the measurement mean; ;
- Min. CPC : the lower bound of its 95% confidence interval at %. This is him what we need to consider in order to draw a conclusion: the CPC calculated based on a small sample is optimistic; ;
- GRR % : the portion of the tolerance accounted for by the measurement error; ;
- Minimum tolerance : the tightest tolerance this instrument can measure; ;
- Resolution and presence of interaction.
In relation to process variation : The question of analysis: Can my model distinguish between the different parts?
- Process Variation : 6 standard deviations of production. This value is either entered in the header (Production Standard Deviation) or calculated based on the parts used for R&R. The first option is by far the best;
- ndc, number of distinct categories : how many distinct levels the instrument can distinguish in the actual output. An NDC of 2 only allows for classifications such as «rather large» or «rather small»; ;
- GRR % this time in relation to the variation in the process.
💡 One way might be Good for sorting, but bad for analyzing, or vice versa. A wide tolerance and very consistent production result in an excellent CPC and a mediocre NDC: sufficient for conformance inspection, but insufficient for a capability study or a design of experiments.
6. Charts Tab
- Chart of Measurements : all values, item by item. Items from the same part must be grouped together.
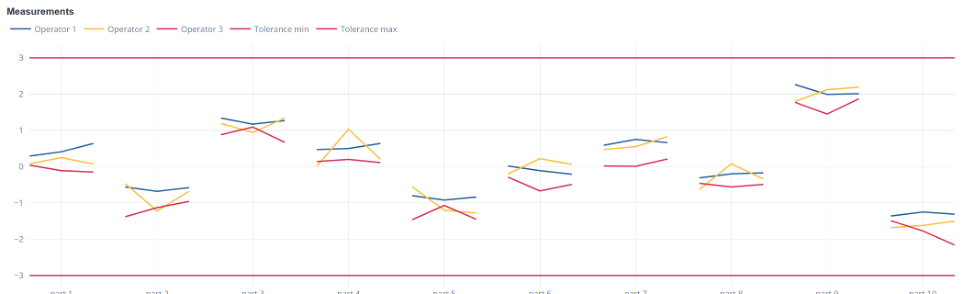
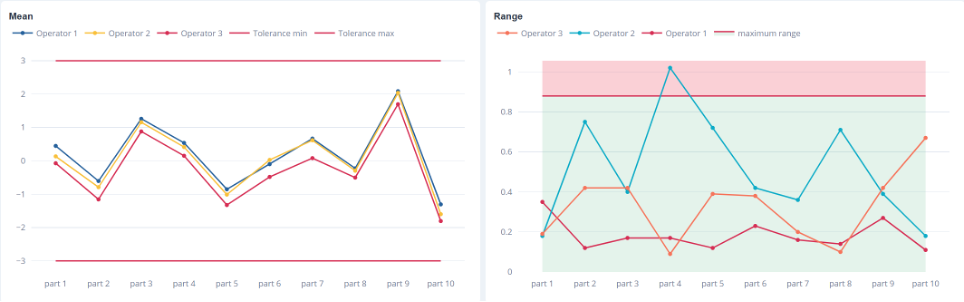
- Chart of Averages : each operator's profile. Parallel and offset curves indicate a correctable bias among operators. Curves that intersect indicate a more problematic interaction.
- Map of Areas : the dispersion of each operator. An operator with significantly higher dispersion needs training.
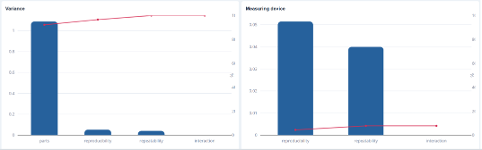
- Camembert and Pareto of variances : the relative contribution of the sources, at a glance. An ideal R&R with nearly 100% of the total variance attributable to the parts and nearly 100% of the measurement variance attributable to repeatability
7. What Should You Do If R&R Is Insufficient?
In ascending order of cost:
- Clarify the procedure and train, if reproducibility is the primary concern; ;
- Improve the editing — support, positioning, clamping — if repeatability is the primary concern; ;
- Increase the number of measurements and calculate their average: the variance decreases by the nth root. This solution works in the lab, but rarely in production; ;
- Change the unit of measurement, as a last resort.
⚠️ Widening the tolerance improves the CPC and % GRR without any changes to the instrument. This is an accounting illusion, not an improvement.