The Inferential Statistics Menu from ELLISTAT It includes six appetizers, but not all of them are equally suitable for the same purpose. This distinction changes how you approach the menu: before choosing an appetizer, you first need to decide whether you’re looking to confirm an intuition or to form one.
| Entrance | What is it used for? |
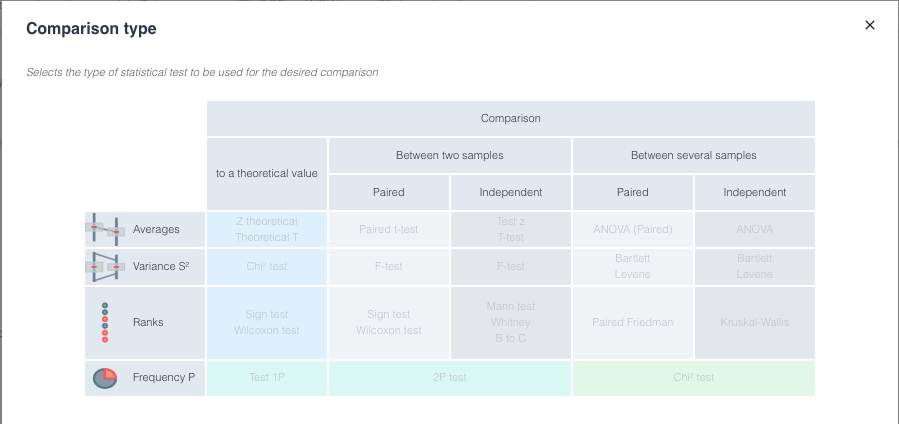
| Test | Test a hypothesis using your table data. This is the main entry point. For one or two samples, this section allows you to test for a difference OR equivalence. |
| Test on Summary Statistics | Perform a test without the raw data, using the sample size, the mean, and the standard deviation. |
| Power | Designing an experiment: How many measurements are needed to detect a given deviation? |
| BOB vs WOW | Compare the best and worst products to see what sets them apart. |
| Component Inversion | Identify, by swapping components, which one is causing the variation. |
| Dichotomous Search | Identify the variable(s) responsible for the quality defect using dichotomous analysis |
💡 The first three are traditional statistical tools. The last two are methods of root cause analysis : They do not test a pre-established hypothesis; rather, they help formulate it.