


A project does not contain a data table, but as many grids as needed. Each grid is an independent table, with its own columns, settings, and data.

Top of the page Project Schedules : the project name, followed by the grid selector and its four initiatives.
| Action | Effect |
| New Schedule | Creates an empty grid in the project. |
| Rename the grid | Change his name. |
| Duplicate the grid | Copies the data and settings to a new grid, which then becomes active. |
| Remove the grid | Deletes the grid and its contents. |
Any grid you create is added to the grid Default, which is included by default in every project.
The Project saves the active grid : When you reopen it, you'll see the one you were working on, and the analysis pages will display it without you having to reselect it.
💡 Make a copy before you try it is the right approach. Cleaning out outliers, transposing data, and recoding categories: these are all operations that we want to be able to compare to the original. Duplicating the data takes just one click and prevents us from losing the initial state of the data—a state that cannot be restored after saving.
Two tabs below the selector:
- grid : the painting itself, with the column panel ;
- data : the list of grid columns with their statistics, in read-only mode.
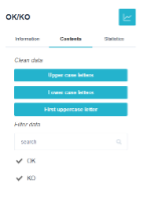
The column panel, on the right, indicates the column where the cursor is located. Three tabs:
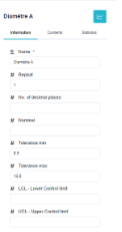
- Information : the name, the rehearsal, the number of decimal places, the nominal value, the tolerances min and max, the LCI and LCS control limits, sigma, the target, the EWMA lambda, the distribution, and the short-term indicator; ;
- Contents : allows you to view the contents of a column and filter the values in that column; ;
- Stats : column statistics that vary depending on whether the column is qualitative or quantitative
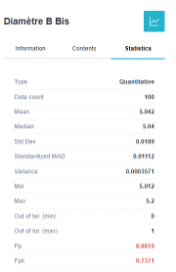
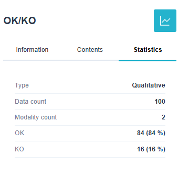
The graphic button at the top of the panel opens the descriptive statistics the entire column, without leaving the grid.
⚠️ Tolerances, the target, and the distribution are not just for show: they are they such as capability indices, control charts, and out-of-tolerance ratios in the analysis menus. A characteristic without a specified tolerance will result in a blank capability page, and the explanation will be here, not there.