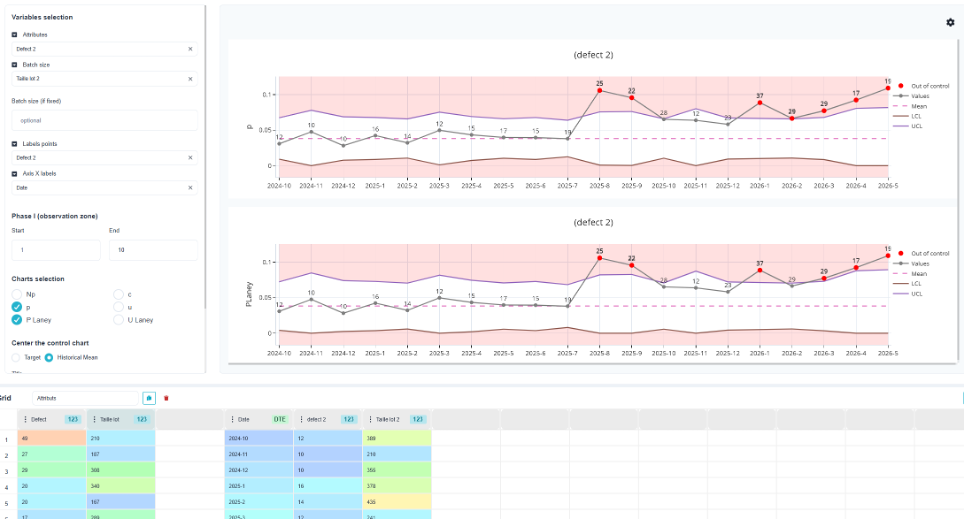
When you’re not taking measurements but counting—such as defective parts or the number of defects—the measurement card no longer applies. Six cards are available:
| Map | Let's follow along | Lot Size |
| p | The percentage of defective parts | variable or fixed |
| No problem | The number of defective parts | fixed |
| c | The number of defects | fixed |
| u | The number of defects per unit | variable or fixed |
| P'Laney | A proportion, in the presence of overdispersion | variable |
| U’Laney | Number of defects per unit, in the presence of overdispersion | variable |
Defective part or number of defects?
A part may have three defects: it counts as one defective part (cards p and Np) but as three defects (cards c and u). The choice depends on the decision to be made.
Laney's Maps
They address a specific situation: with large batches, the standard limits become so tight that almost all data points fall outside them. It is not the process that is out of control; rather, the binomial or Poisson model is too optimistic, and there is additional variation between batches. The P’ and U’ charts take this into account.
Settings:
- Map Selection and batch size (fixed or dedicated column); ;
- Phase I (observation zone), with a beginning and a end : the reference period used to establish the limits. The following points are evaluated relative to this period; ;
- Historical Average to use a known reference value rather than recalculating it; ;
- Center the control chart, the X-axis labels, and the same uncontrolled rules as on the measurement cards.
💡 Define Phase I over a period of time well-managed and representative. Setting boundaries during a turbulent period amounts to accepting chaos as normal.